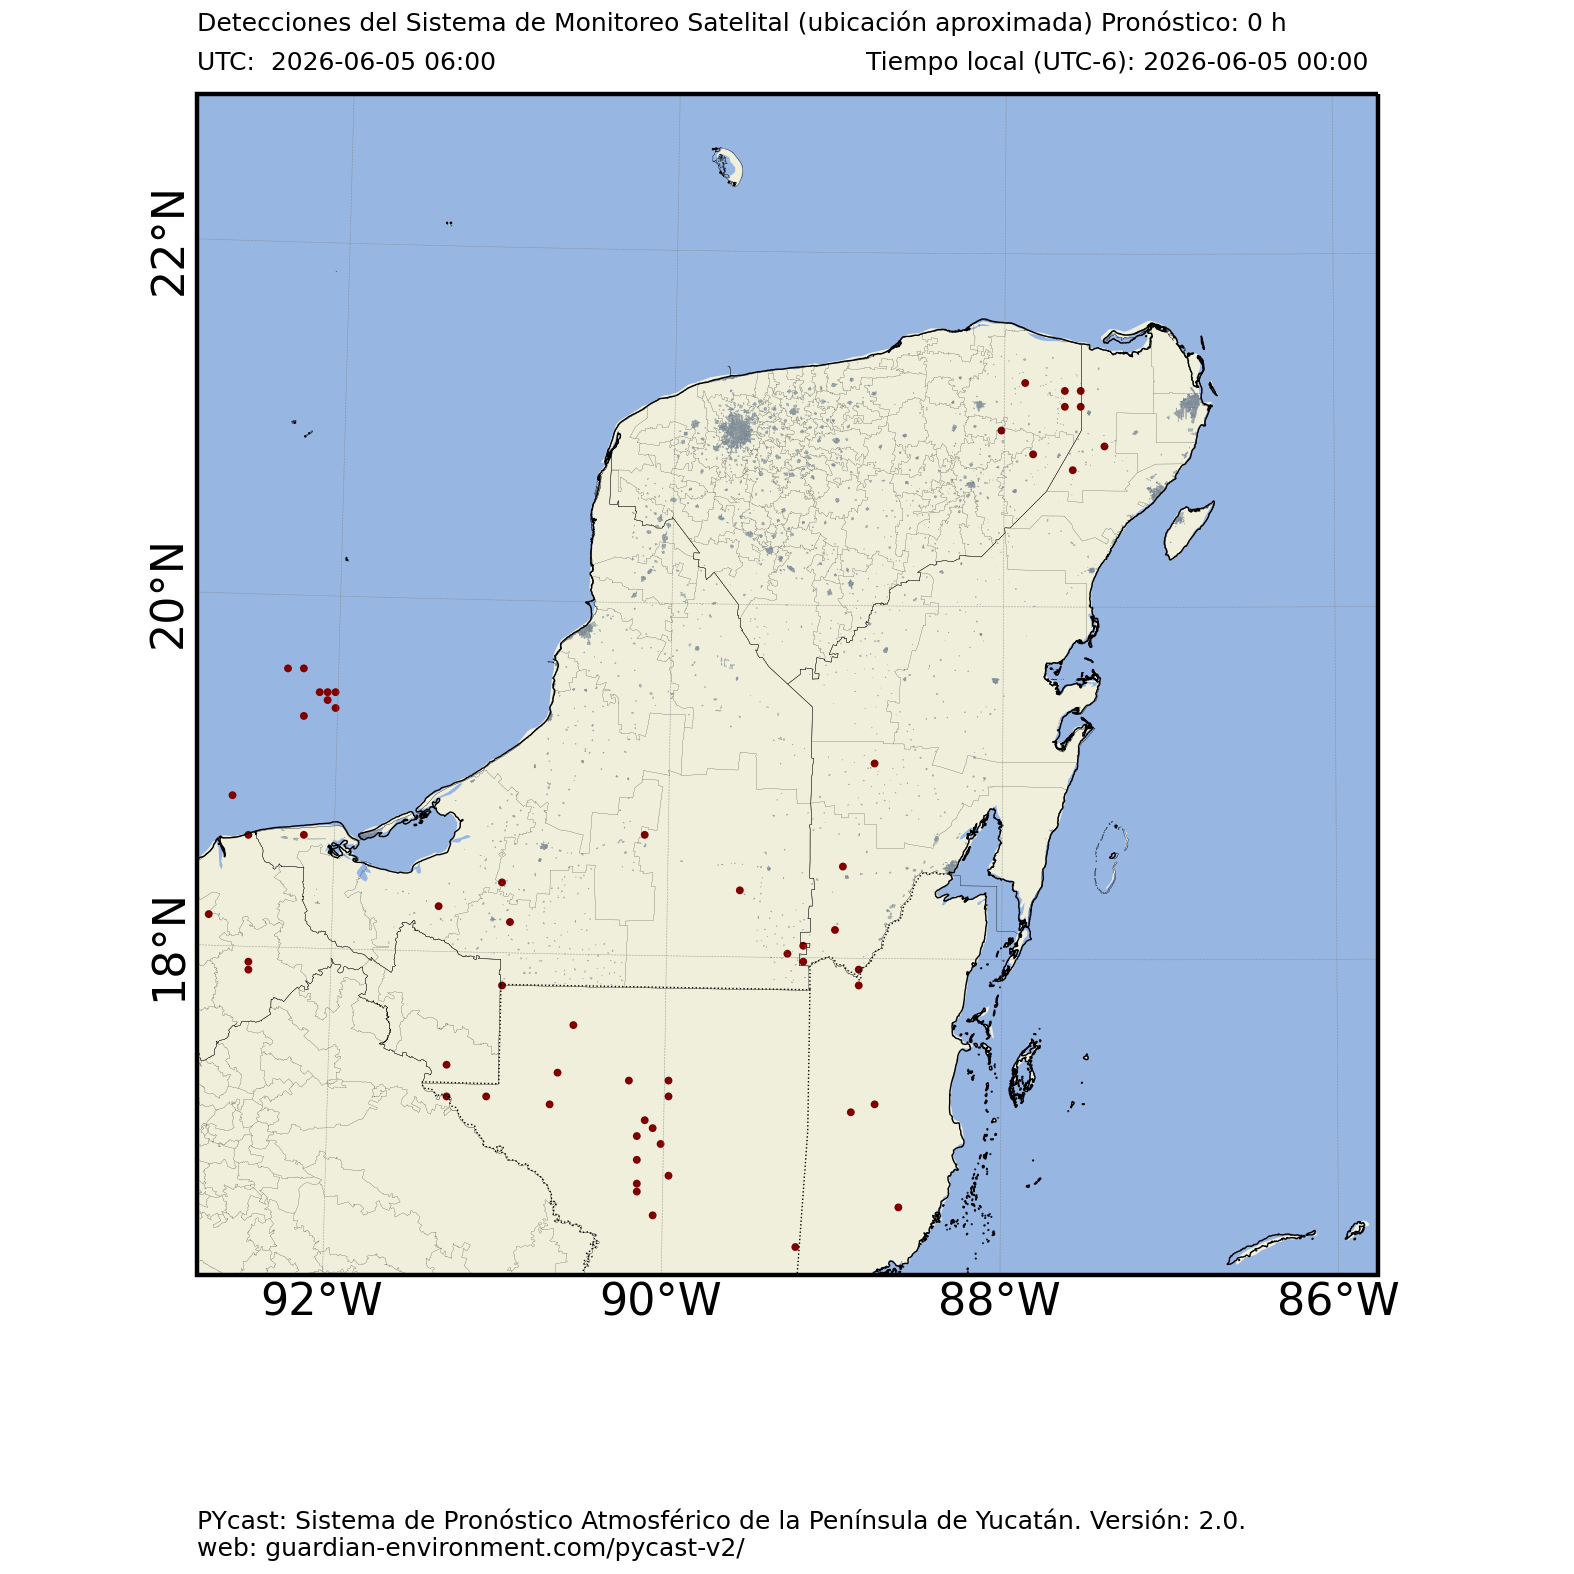
Satellite detections
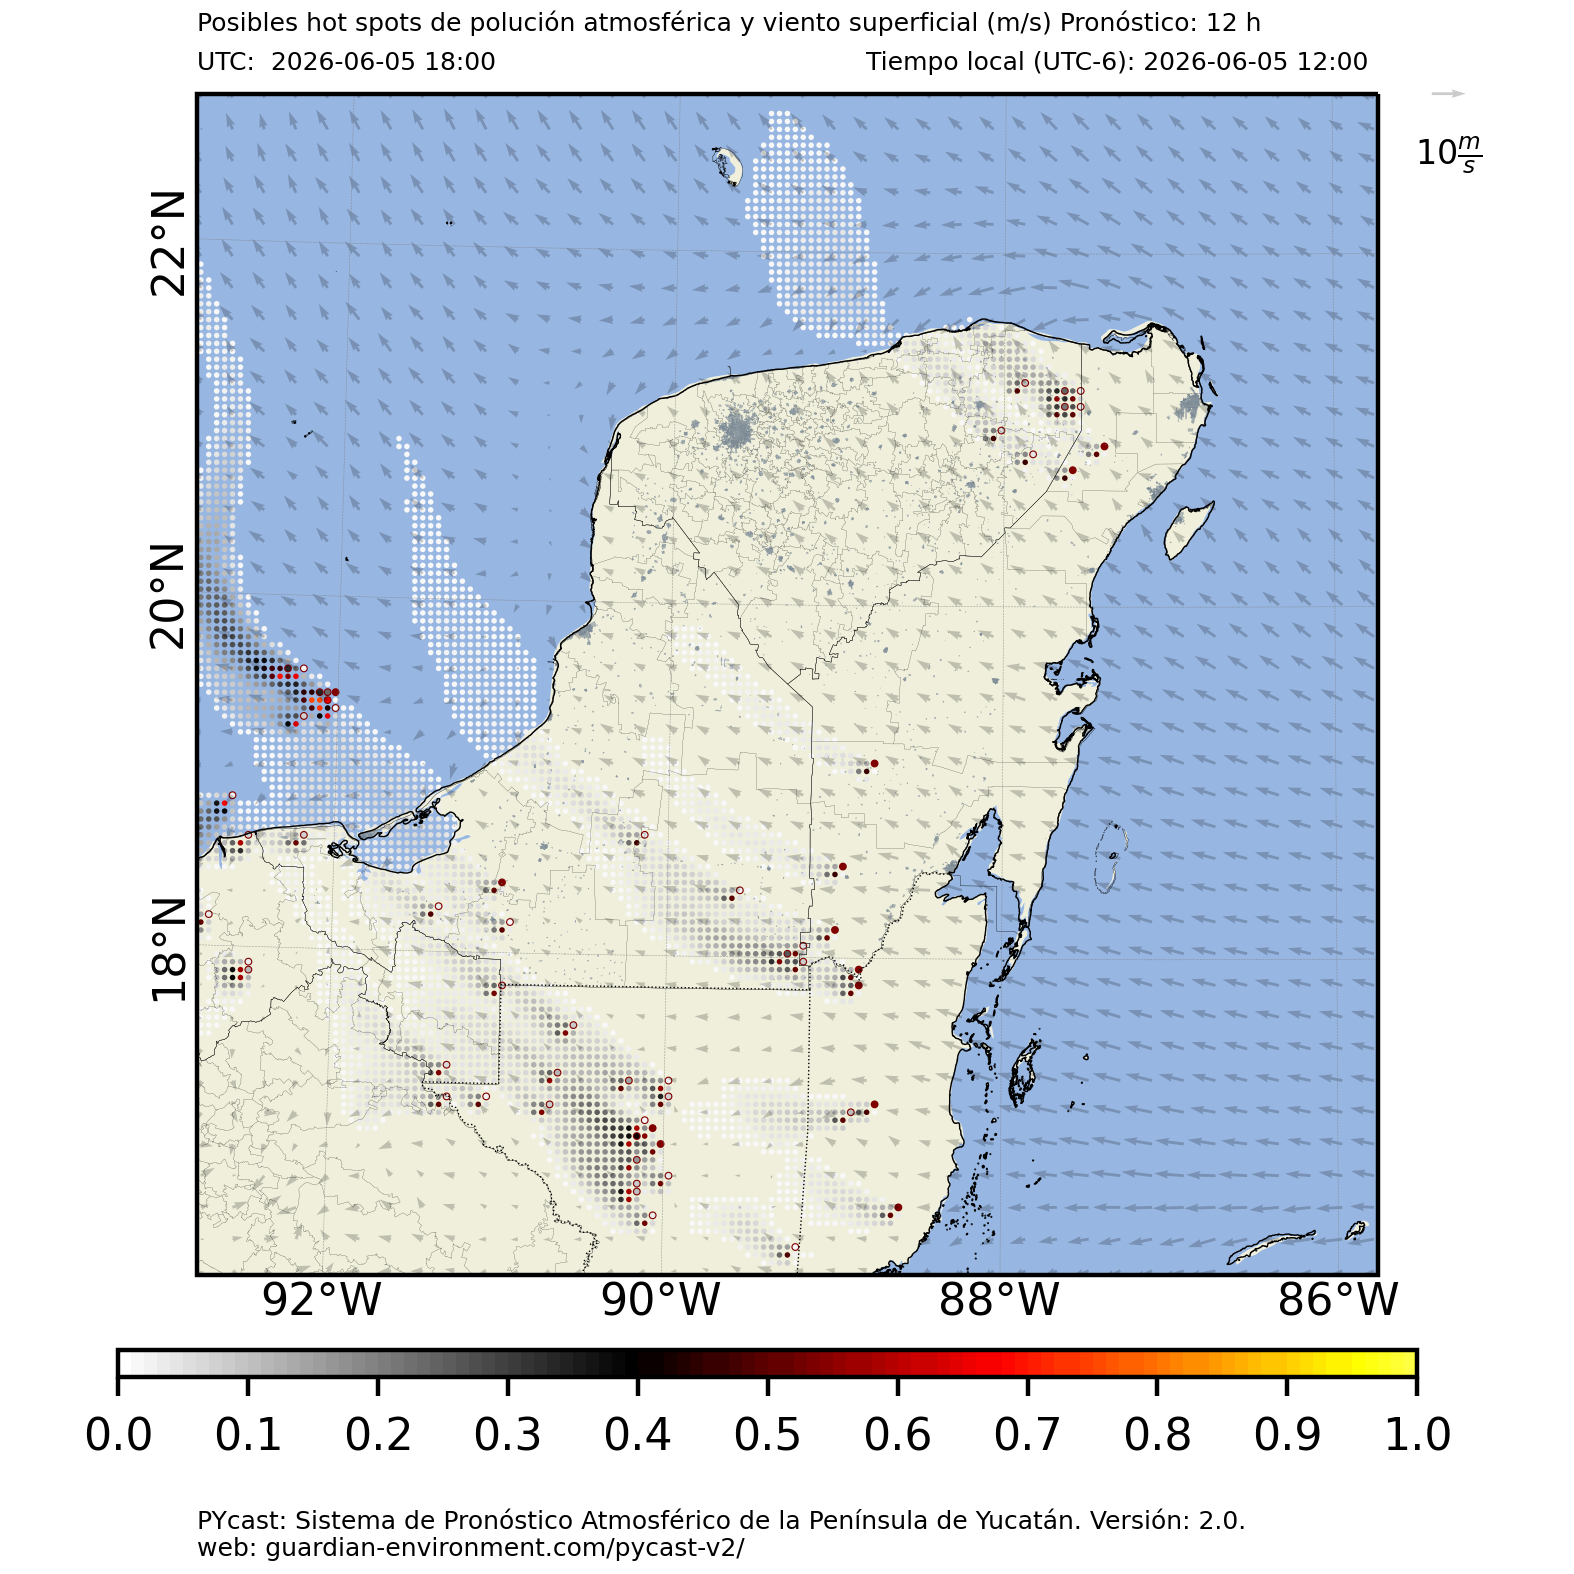
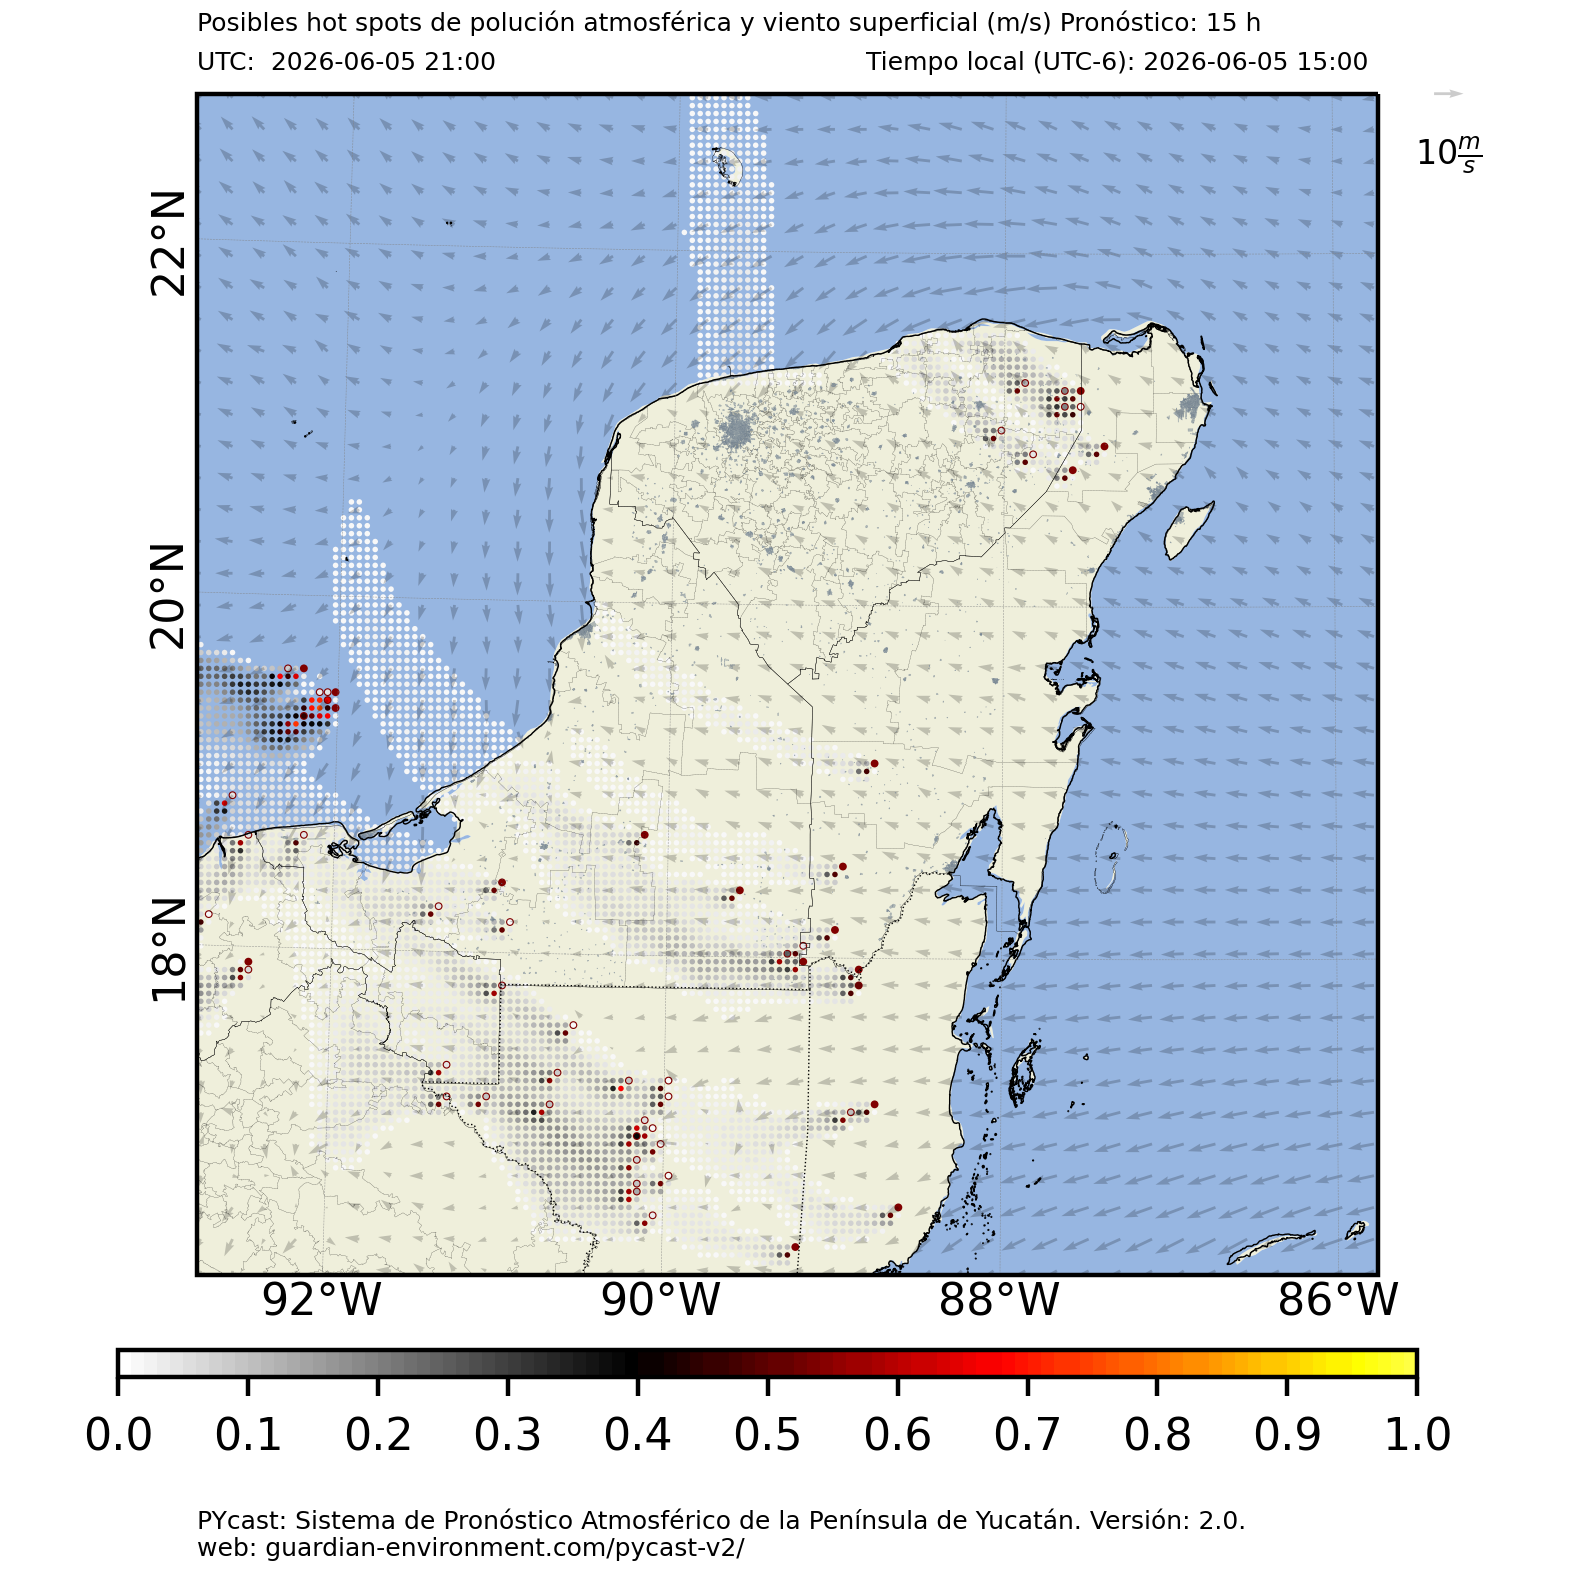
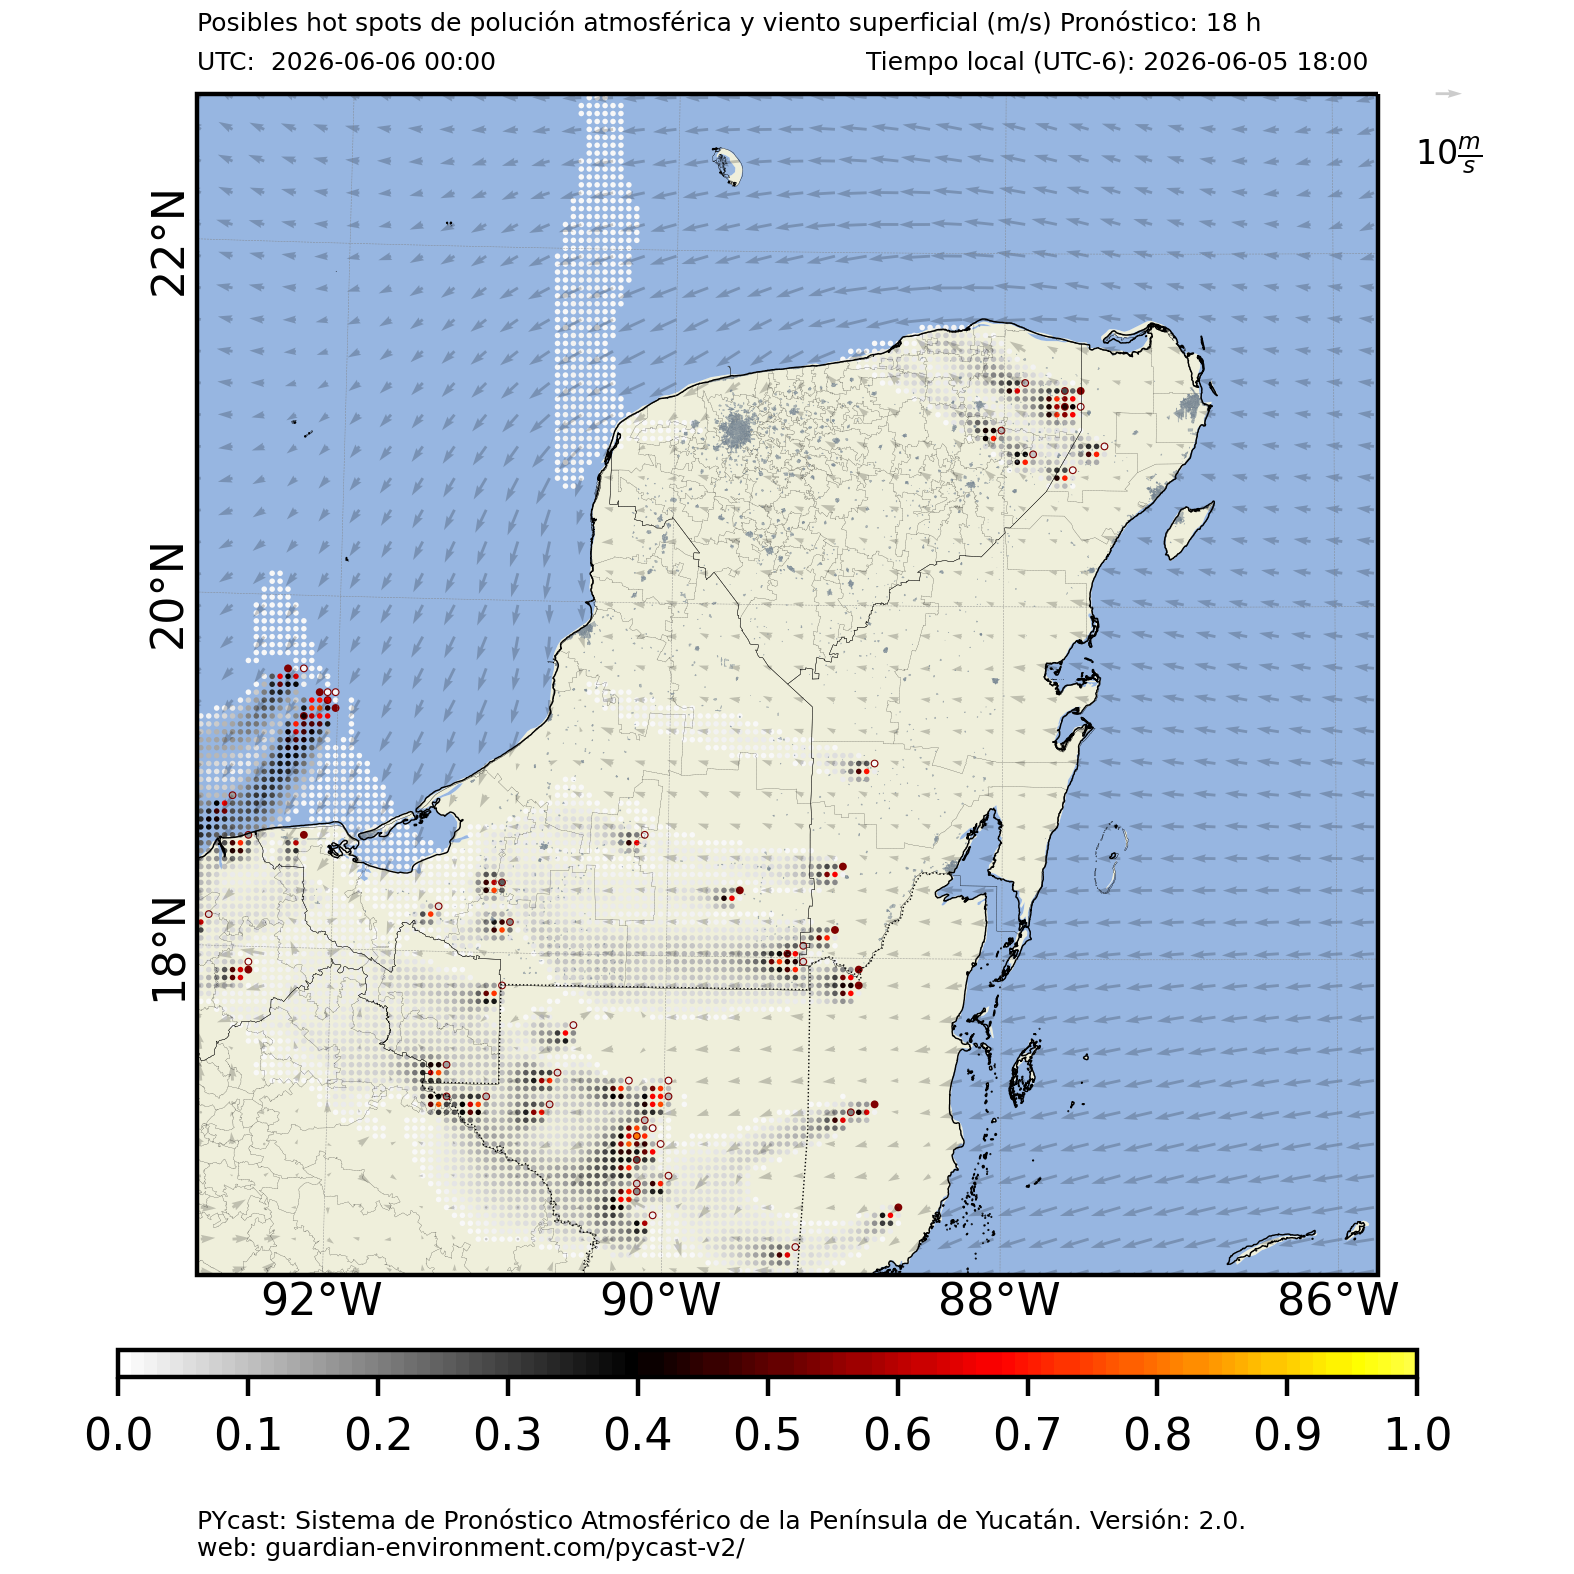
Puntos (color marrón) detectados por satélite y usados por PYcast Kauil para calcular la posible ubicación de hot-spots y su respectiva pluma de dispersión de contaminantes a nivel superficial.
Points (maroon coloured) detected by satellite and used by PYcast Kauil to calculate the possible location of hot-spots and their respective pollutant dispersion plume at surface level.
Hot-Spots & Dispersion plumes (3 h)

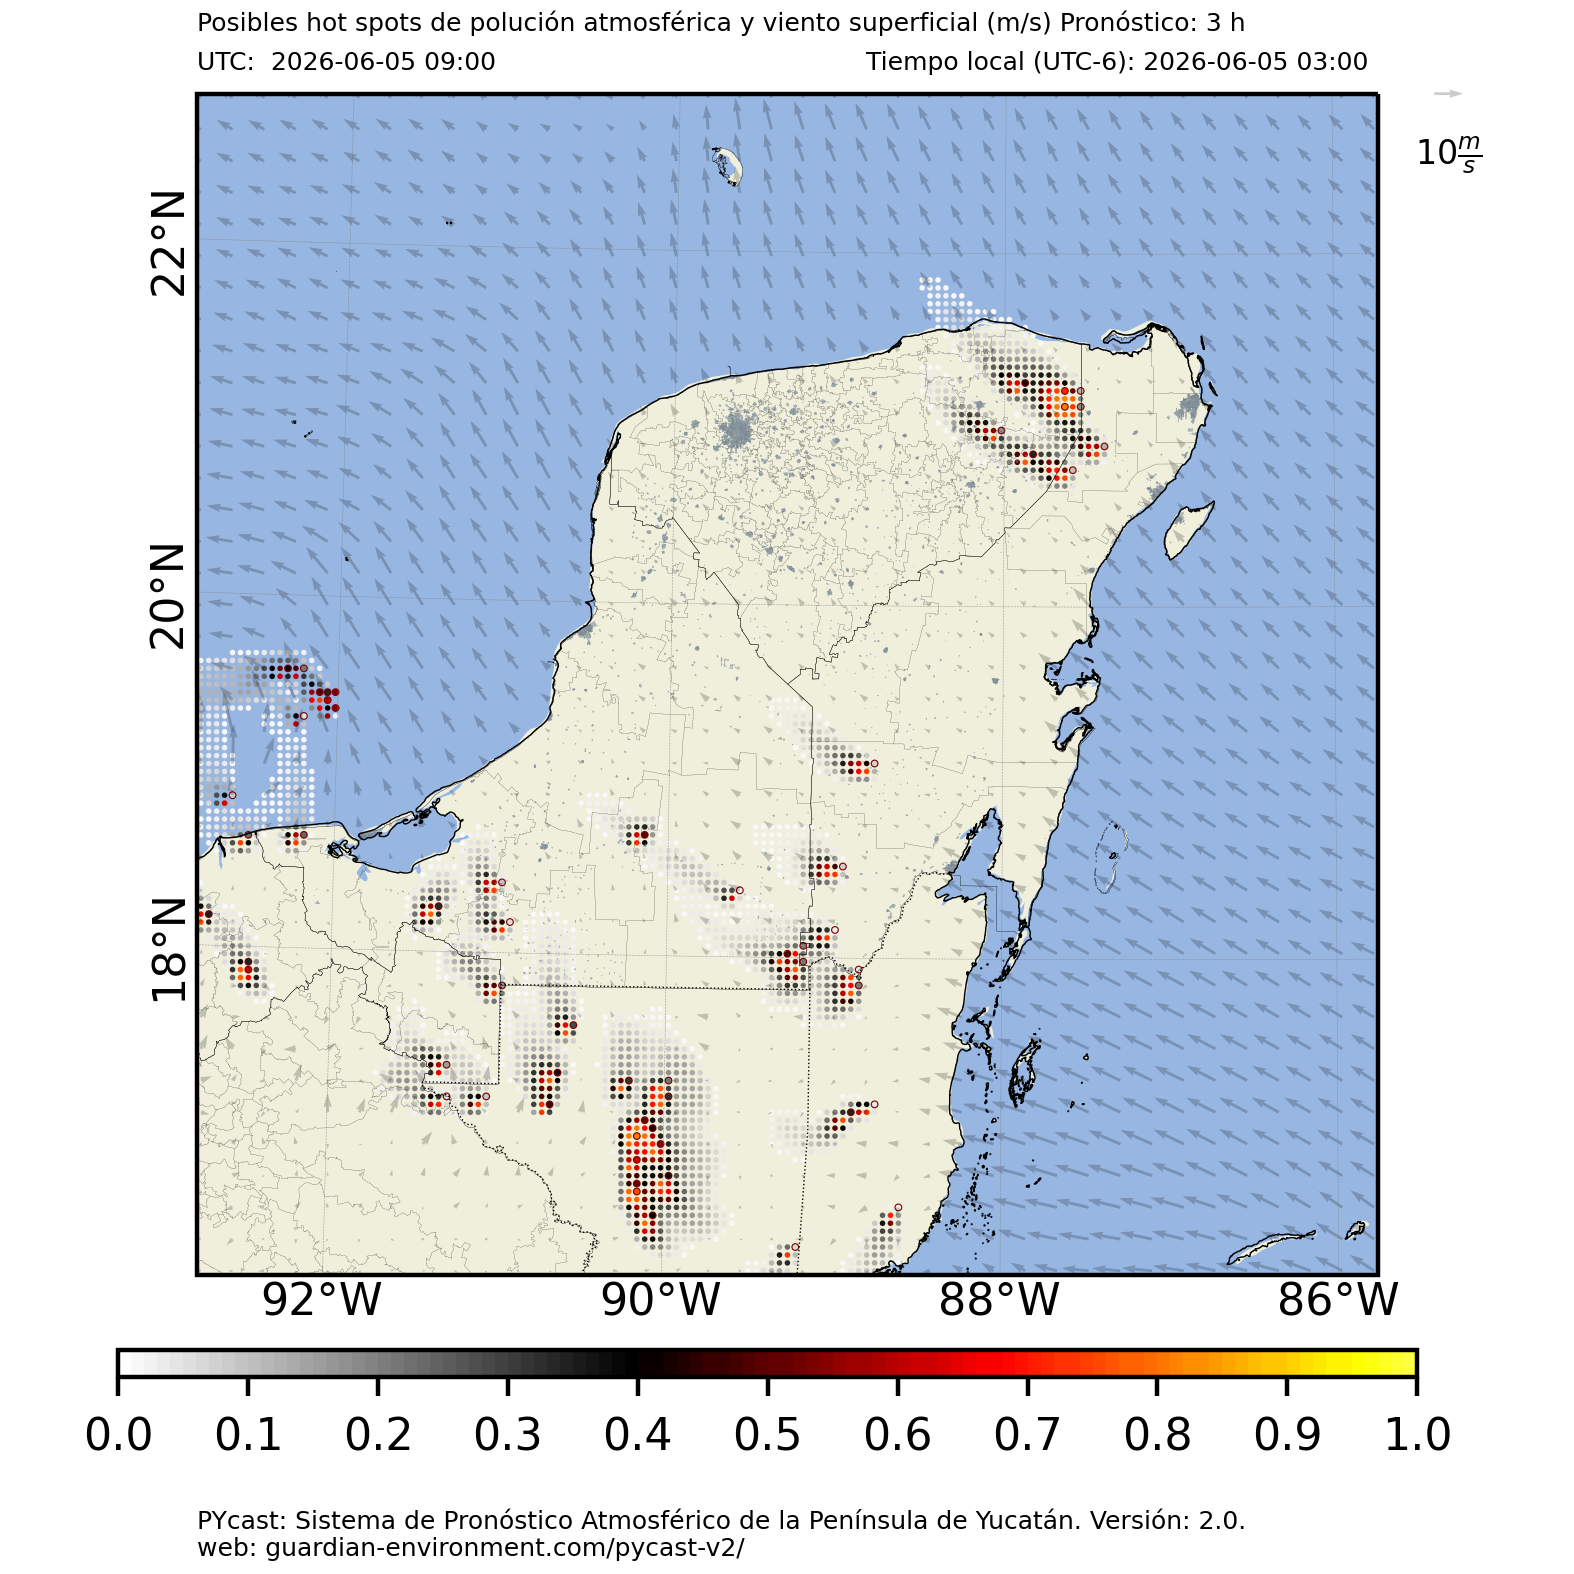
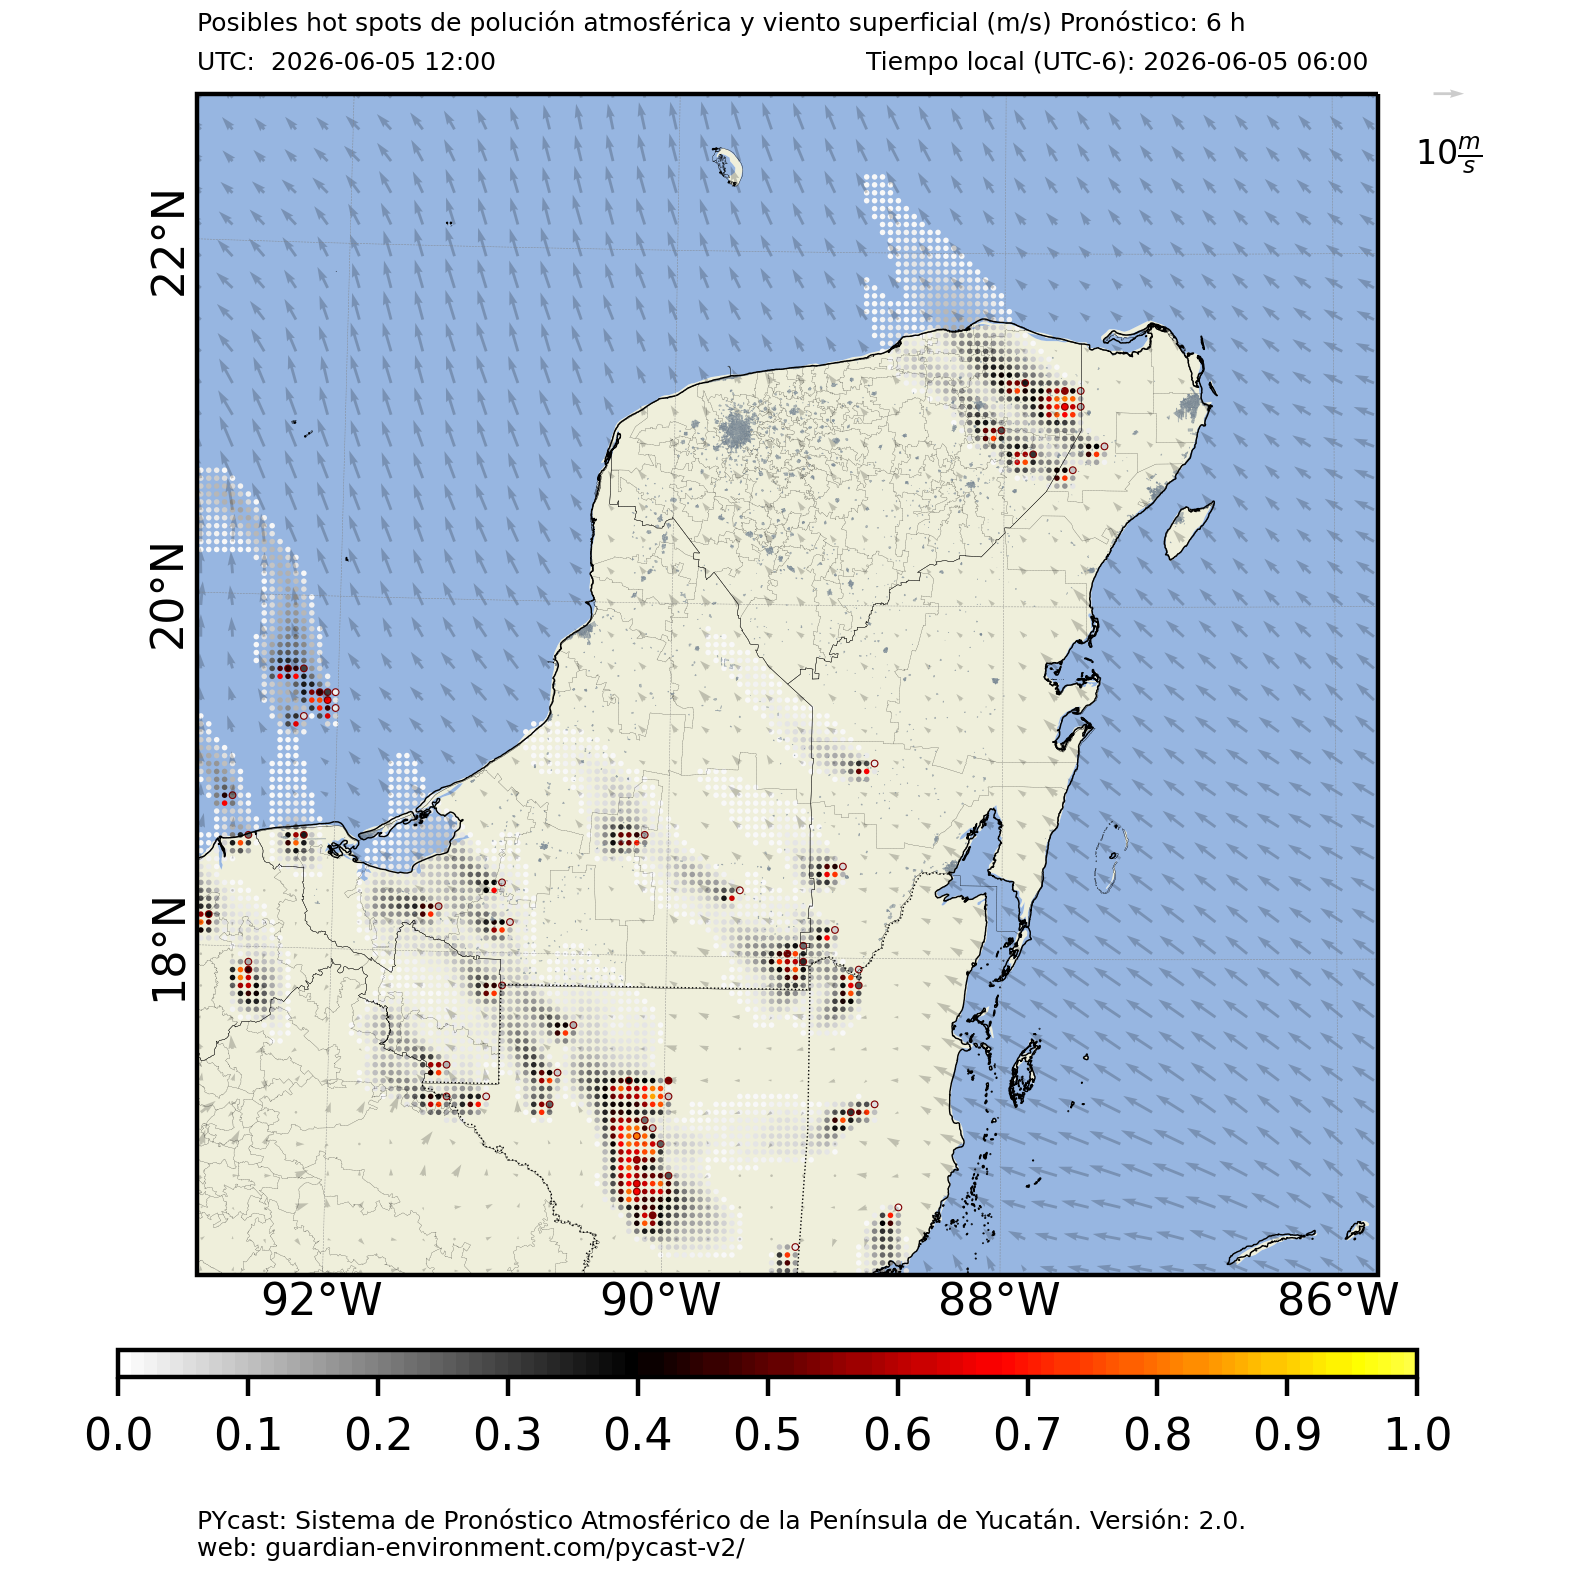
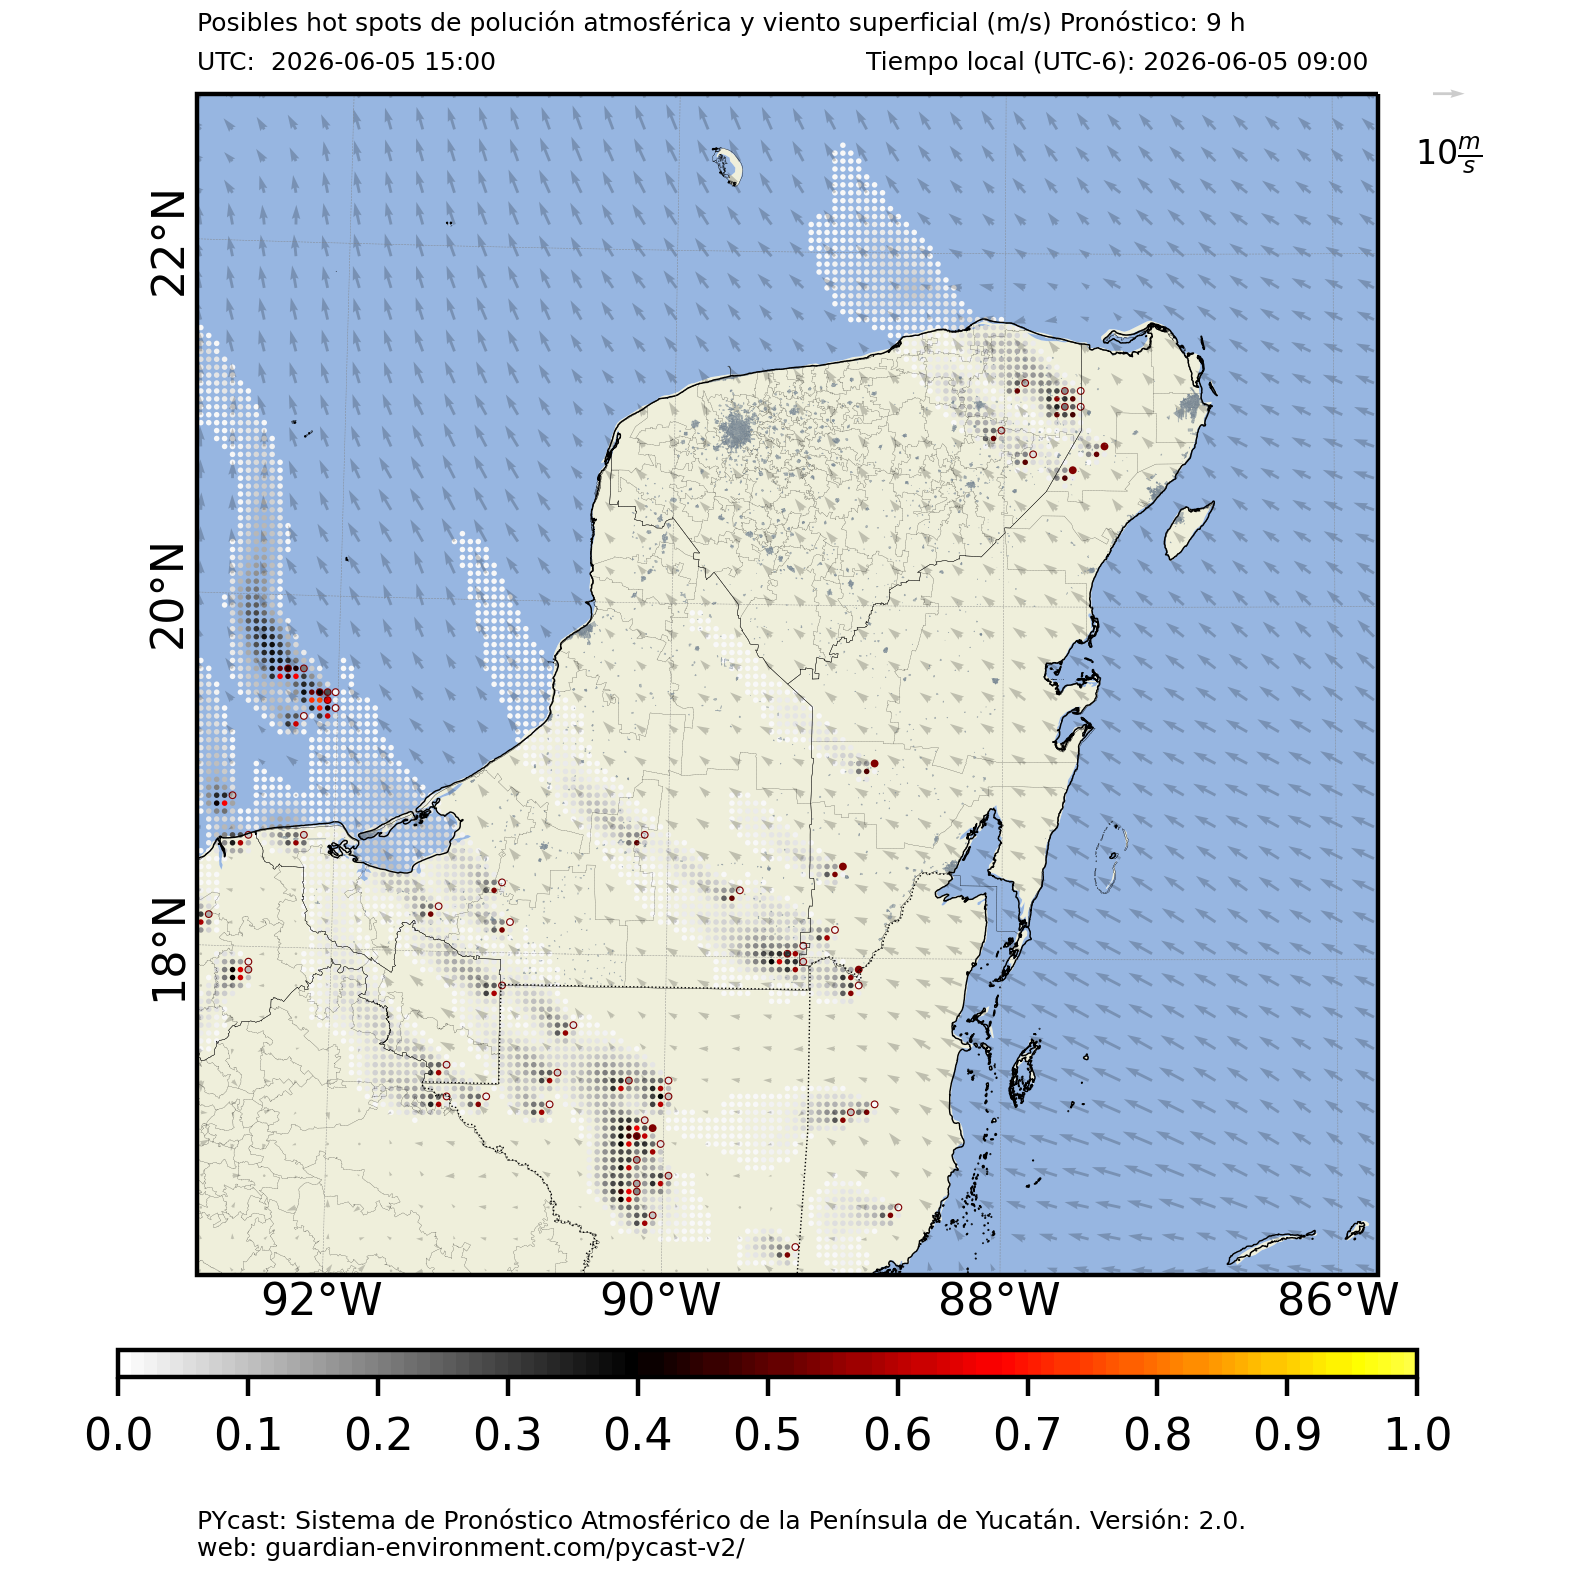
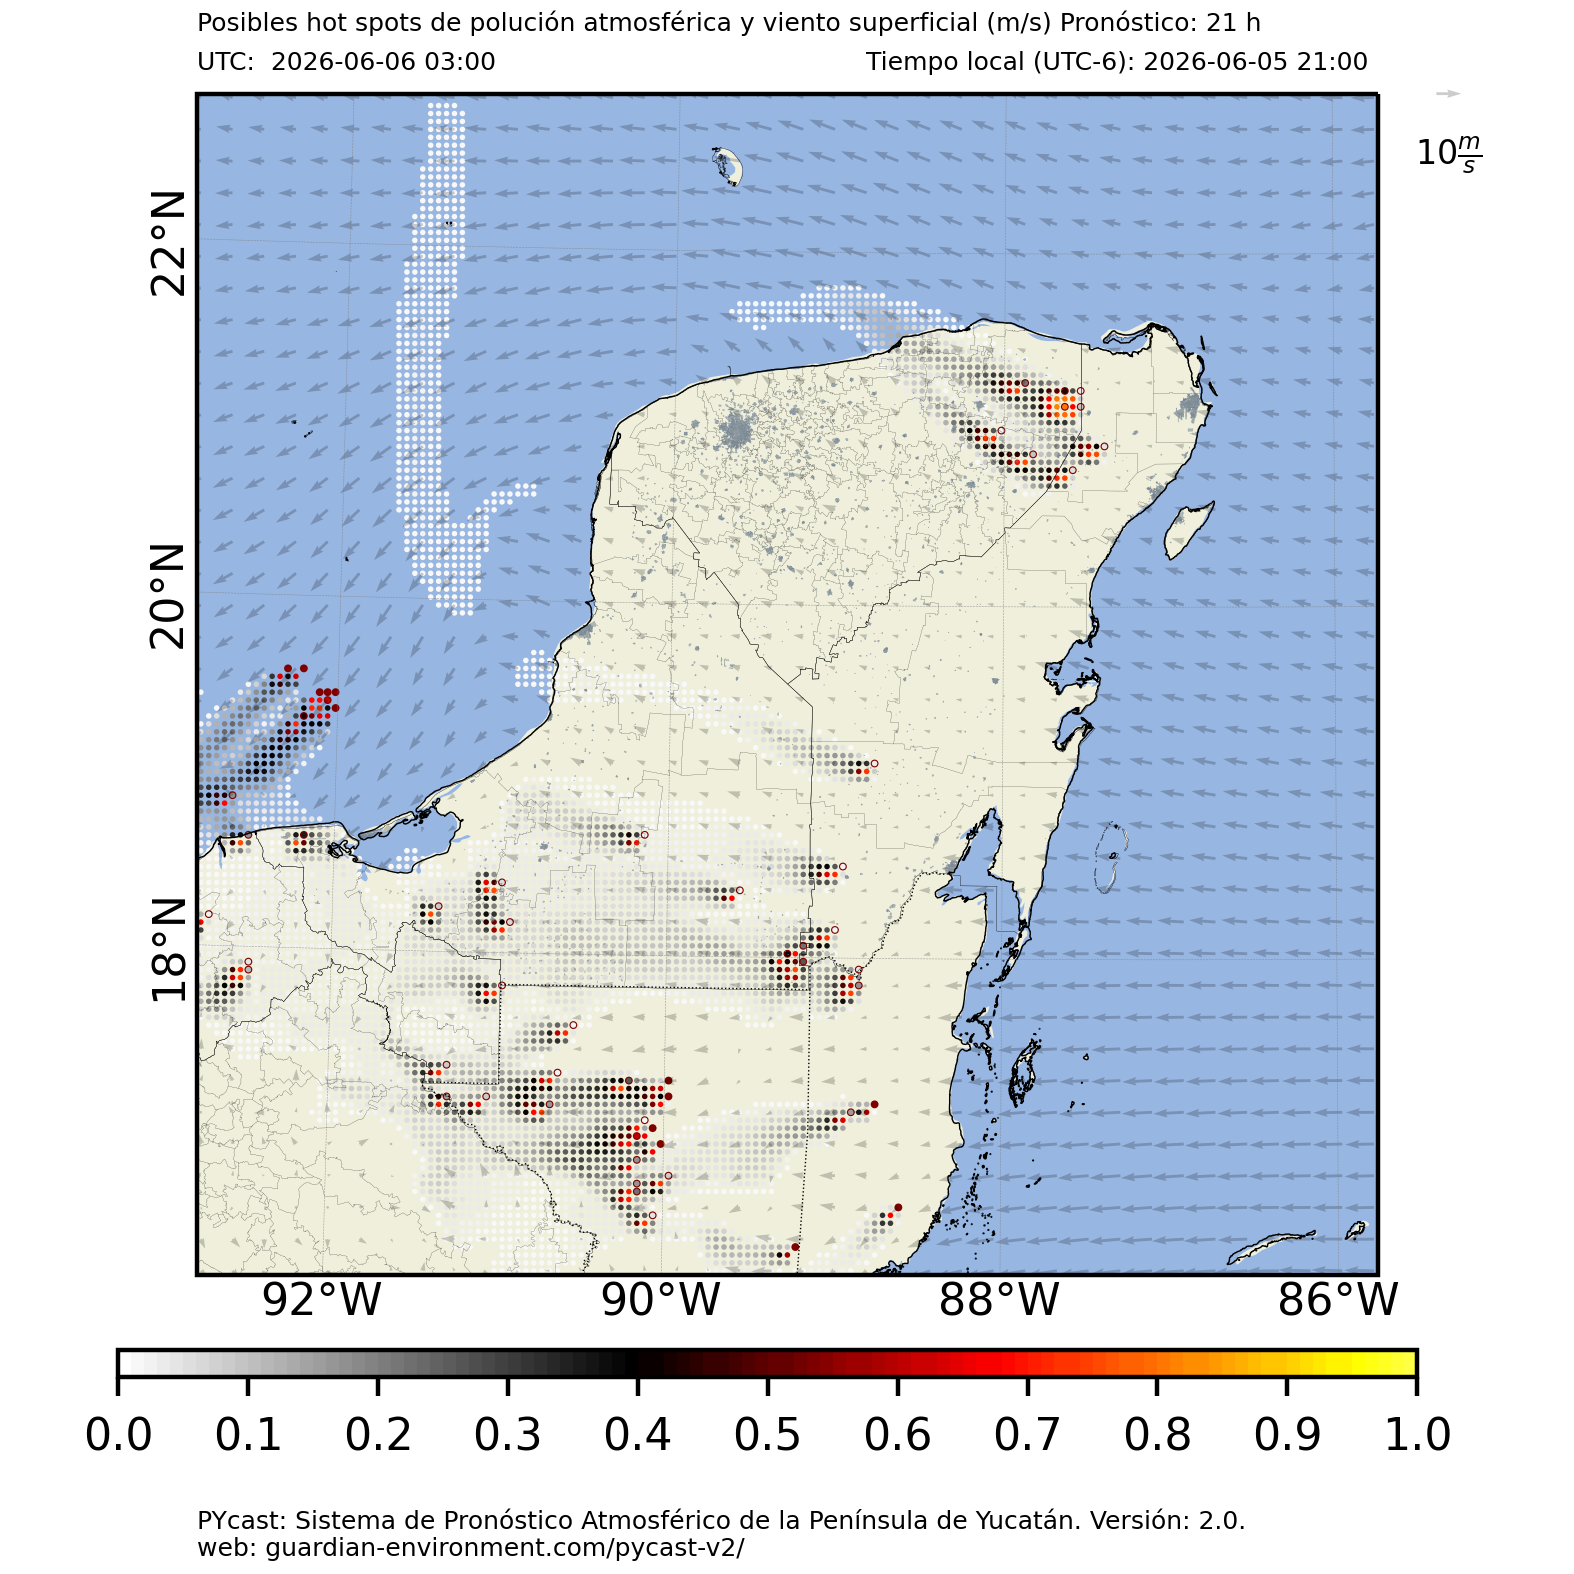
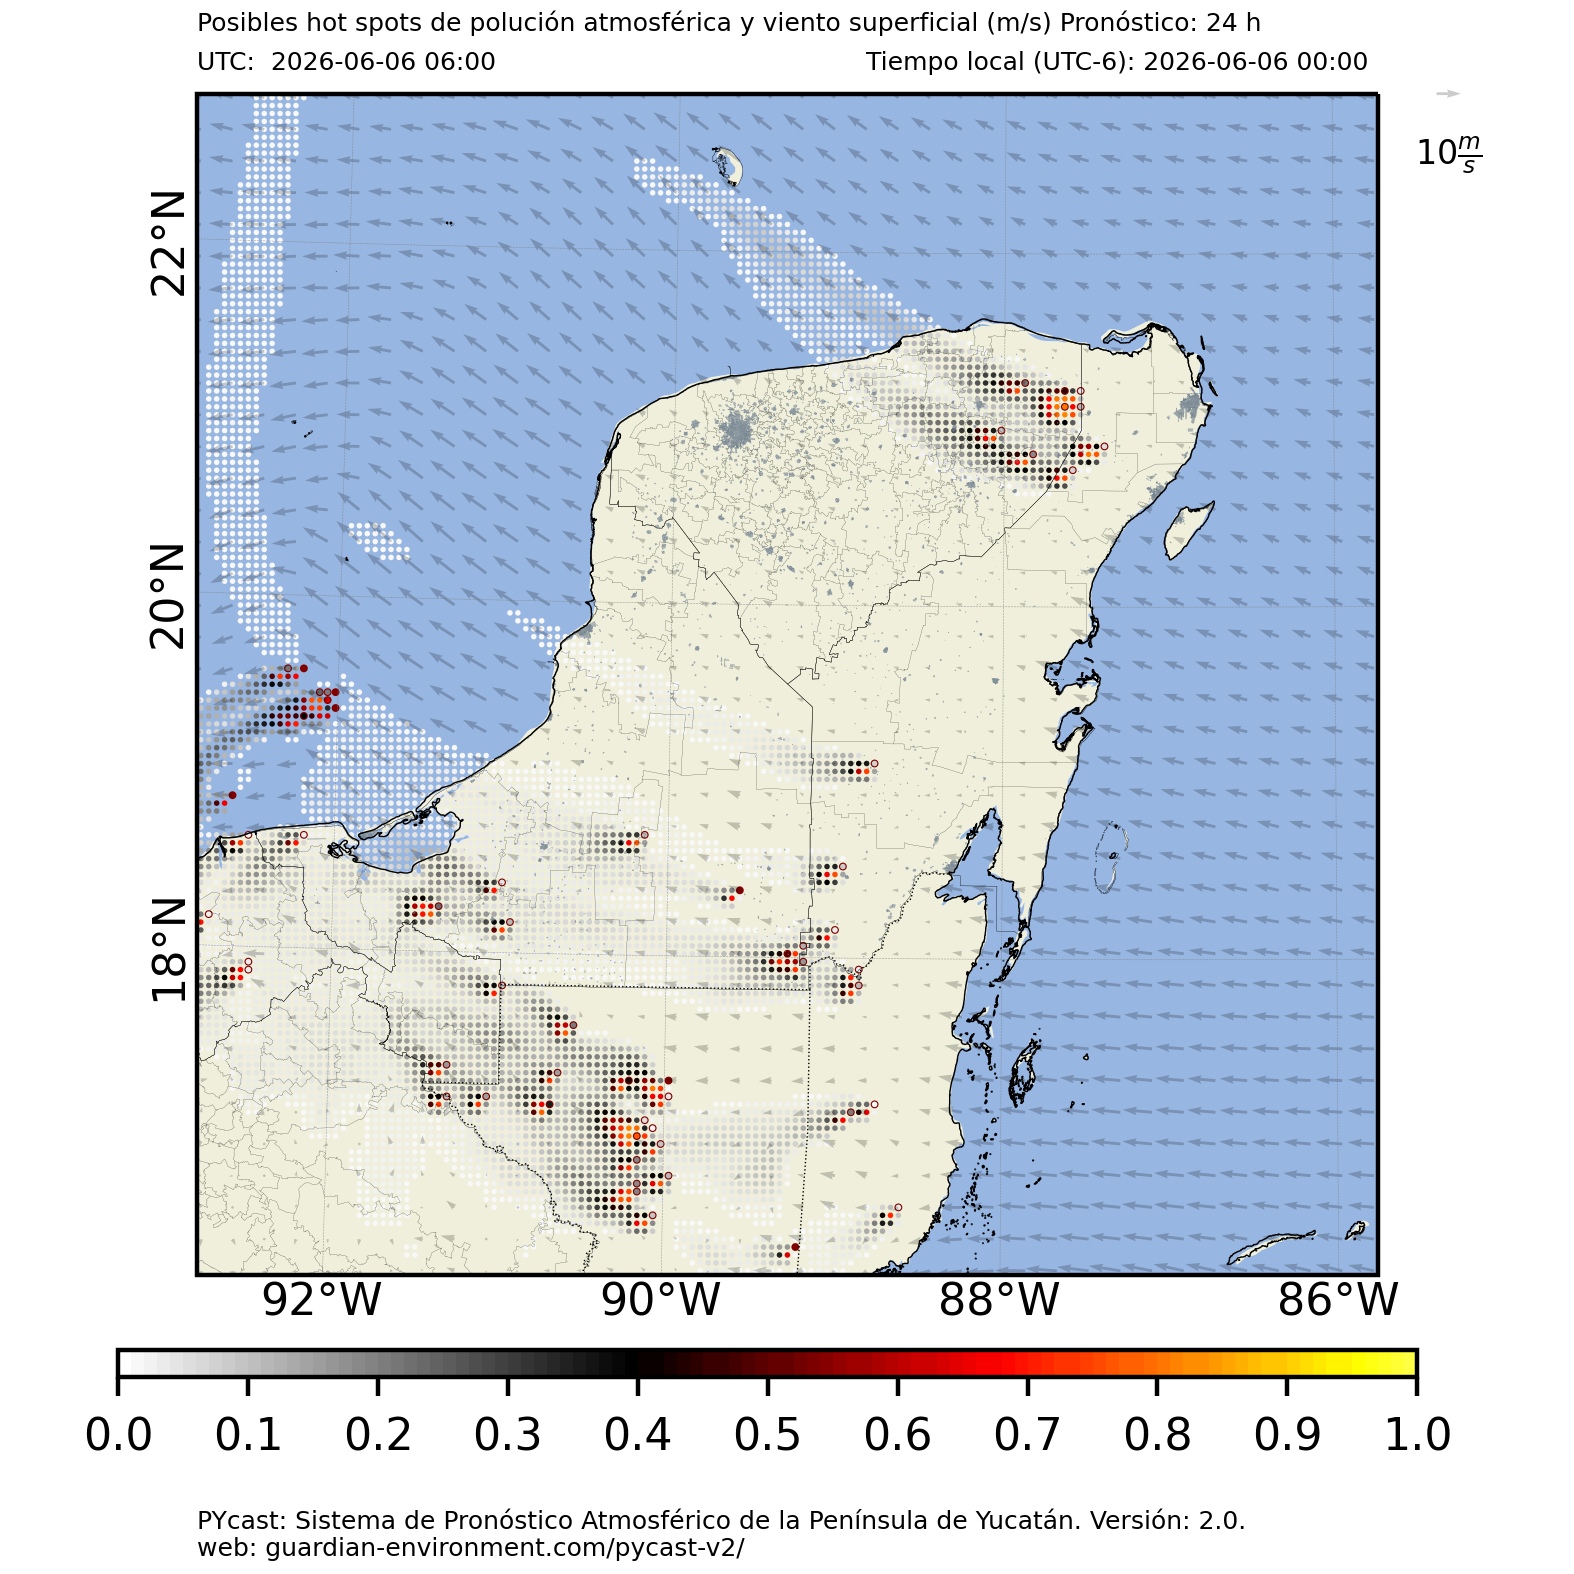

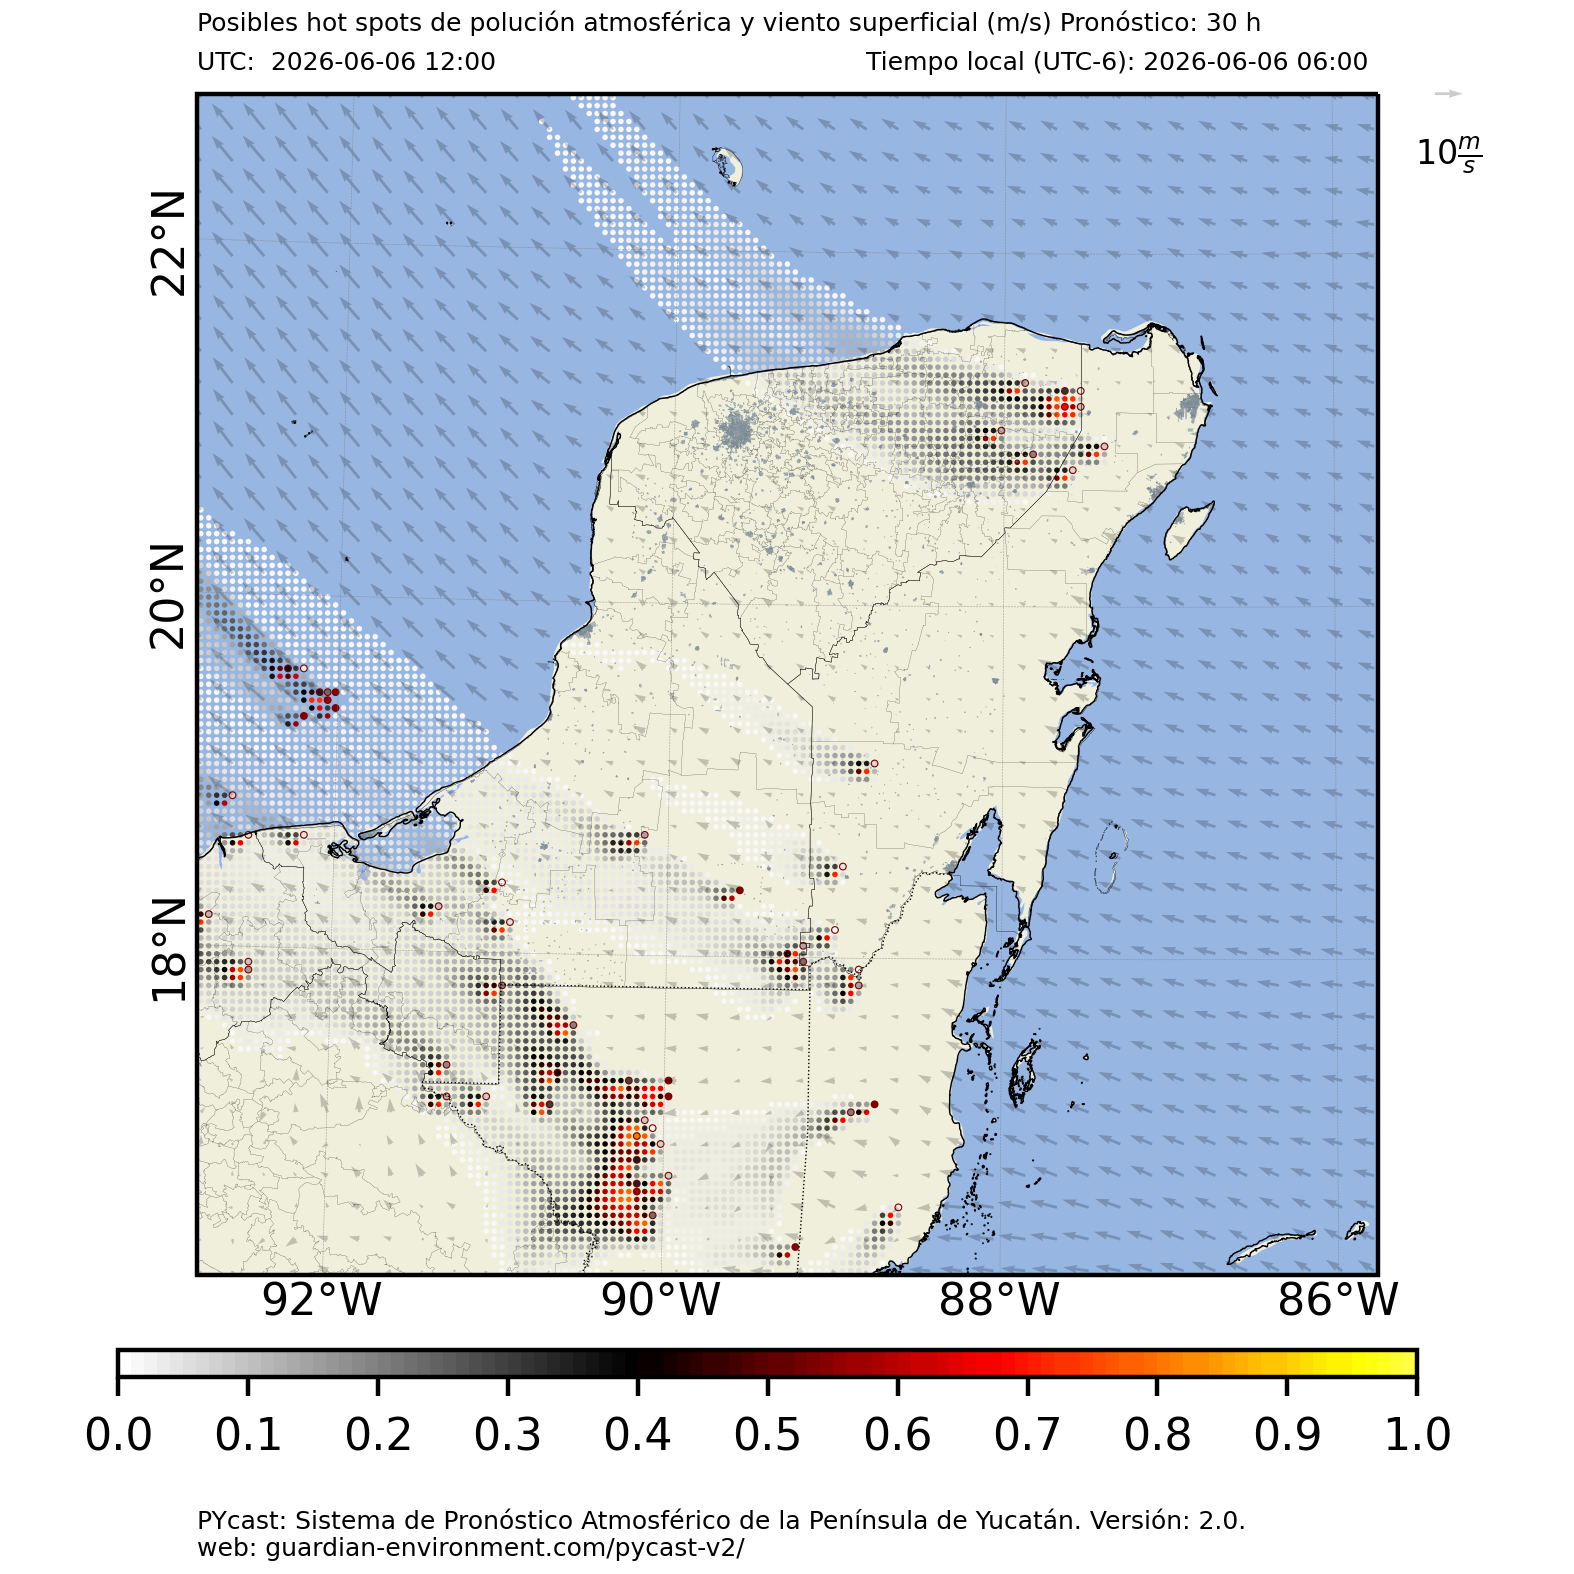
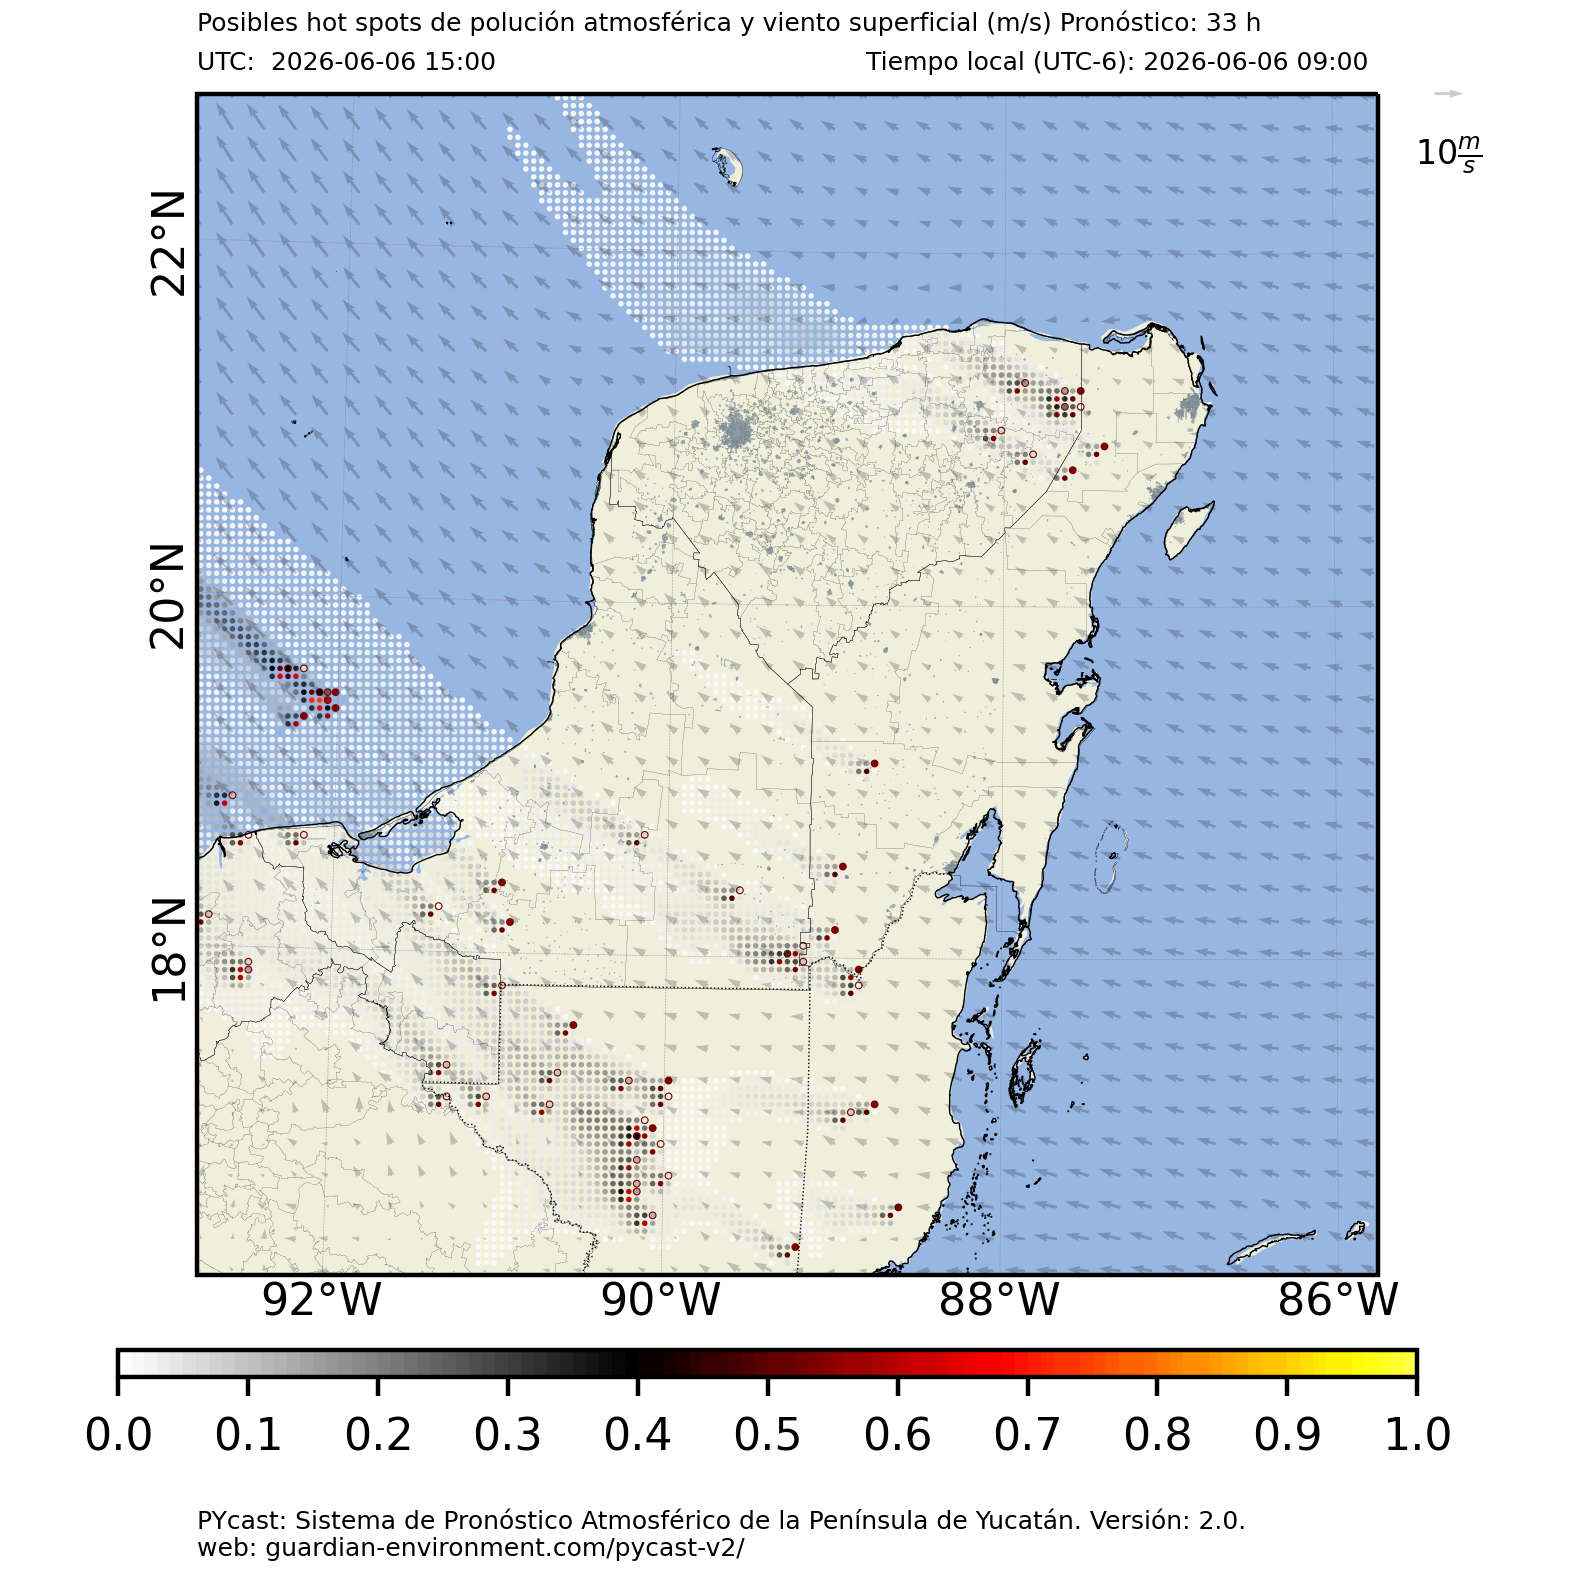
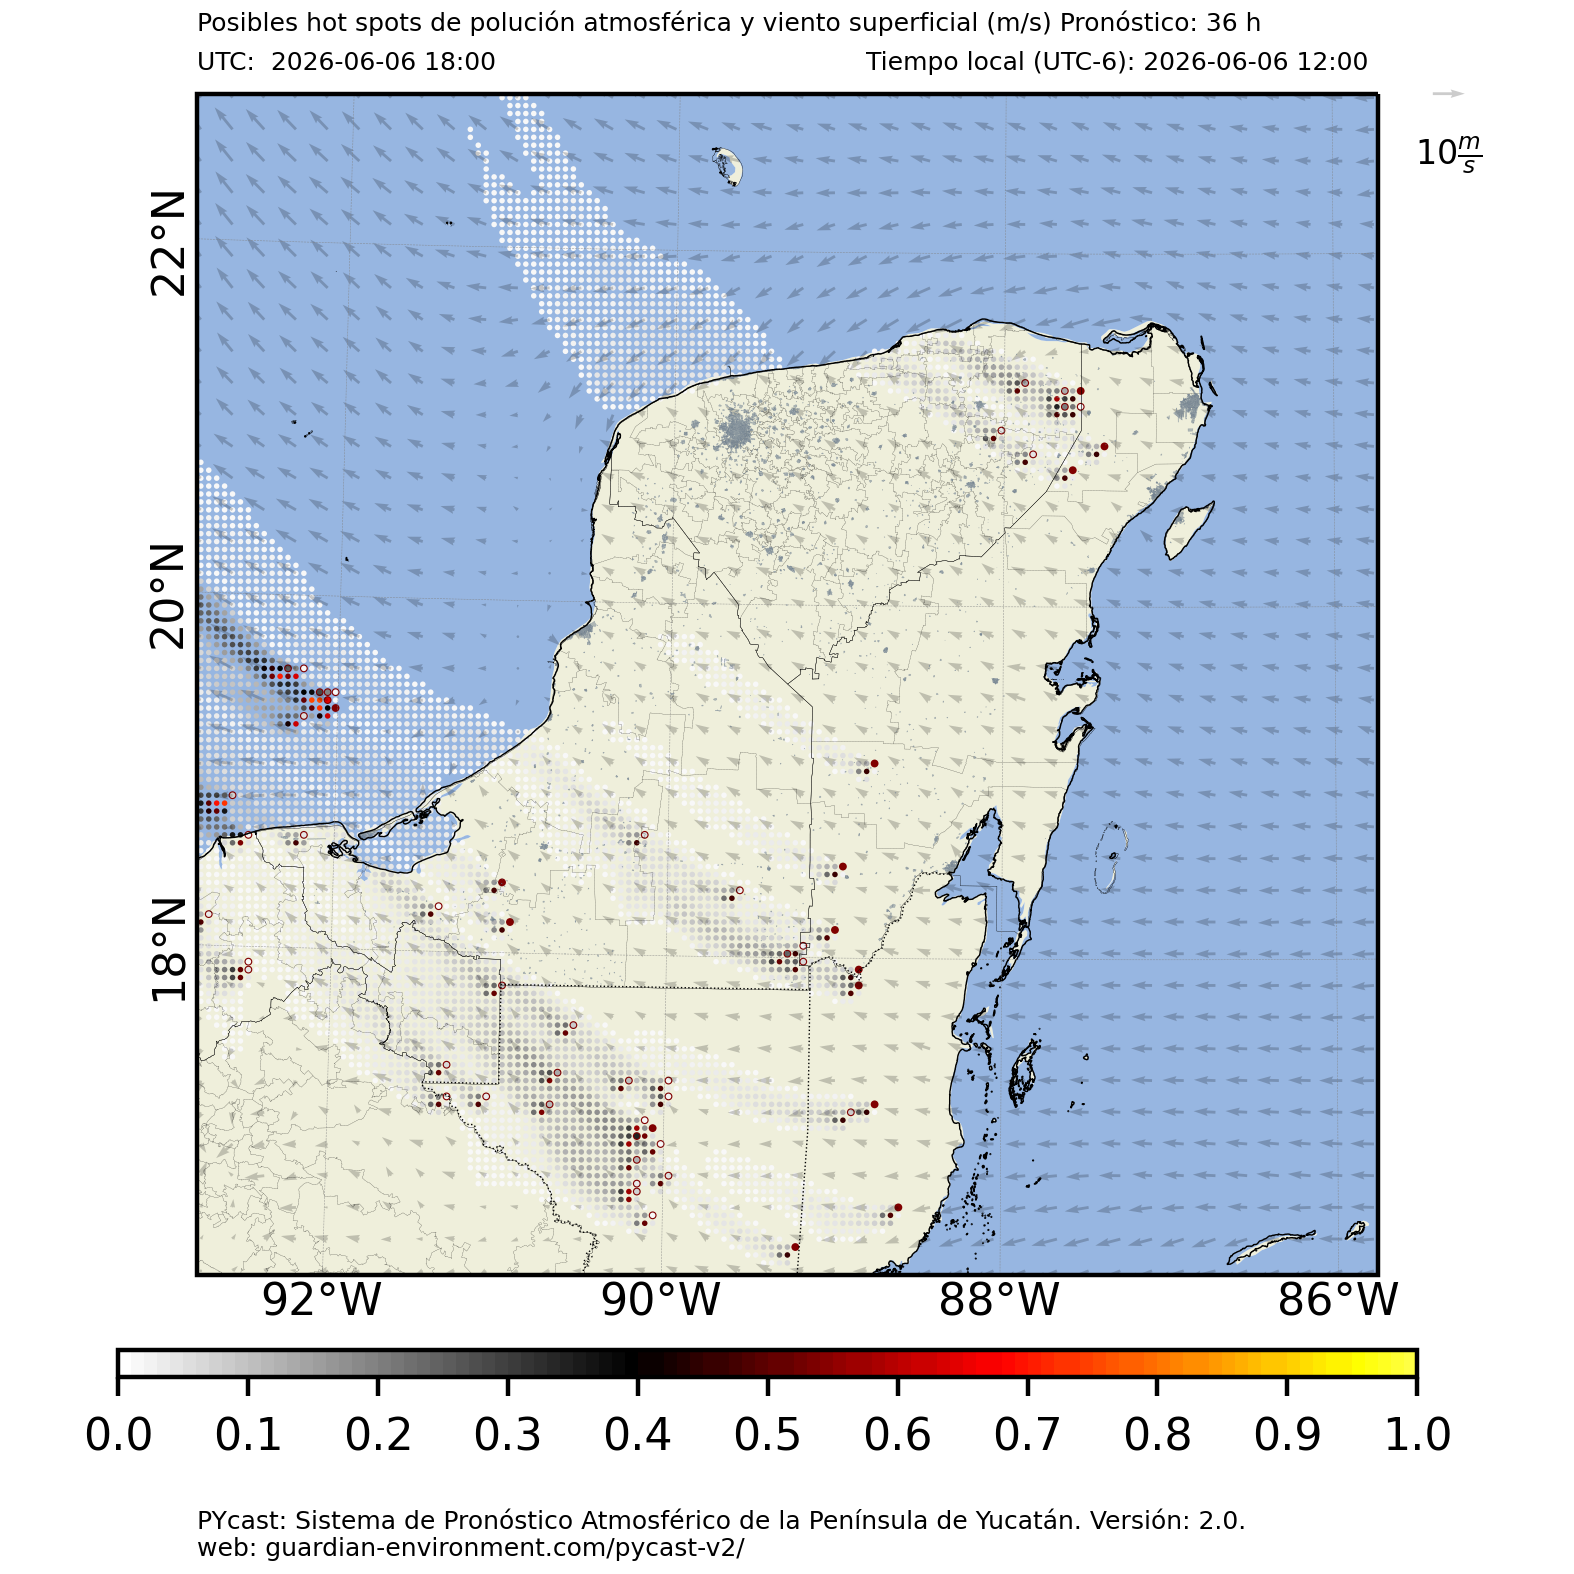
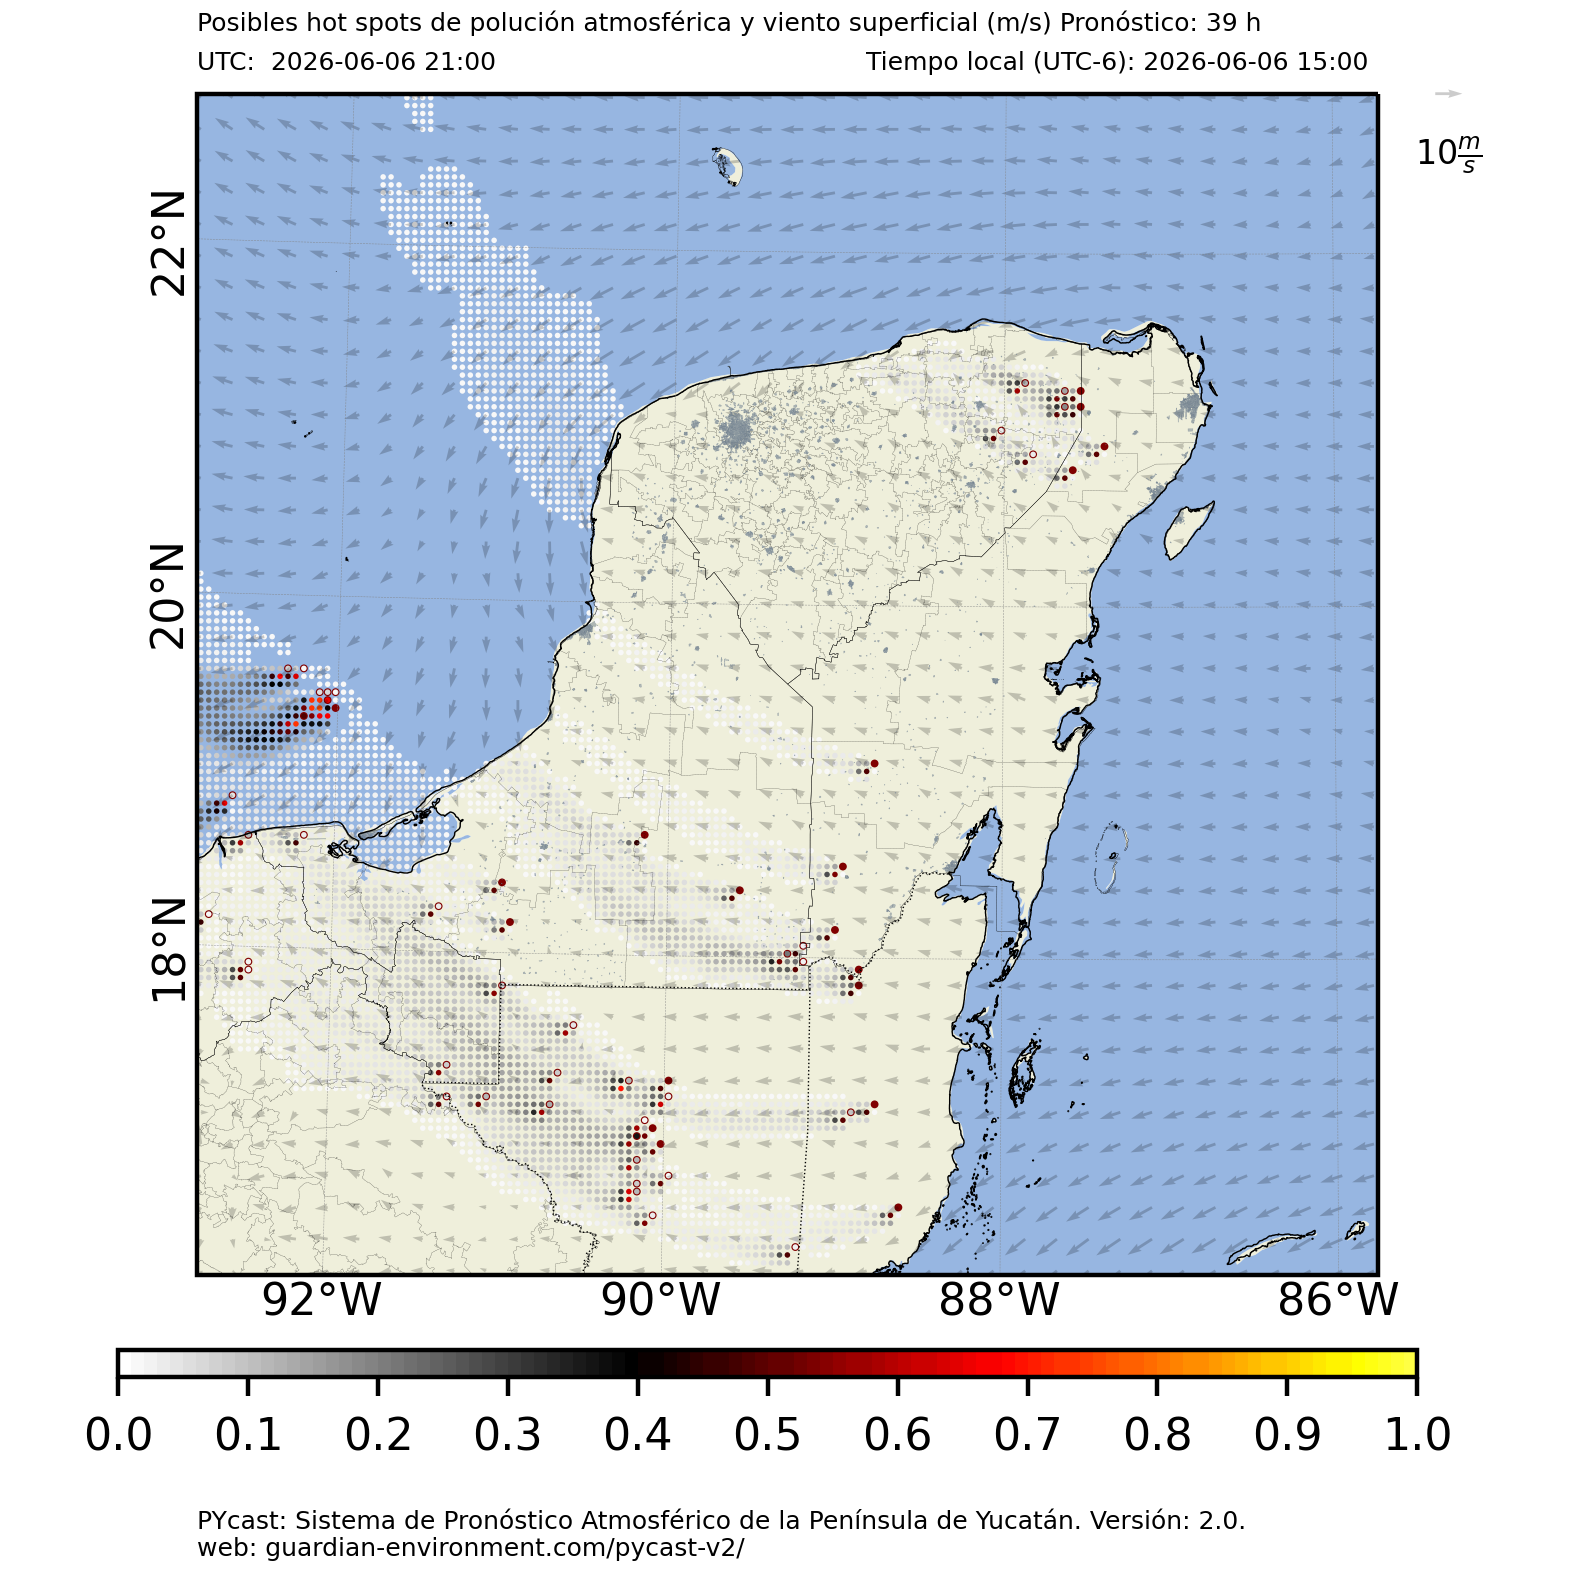
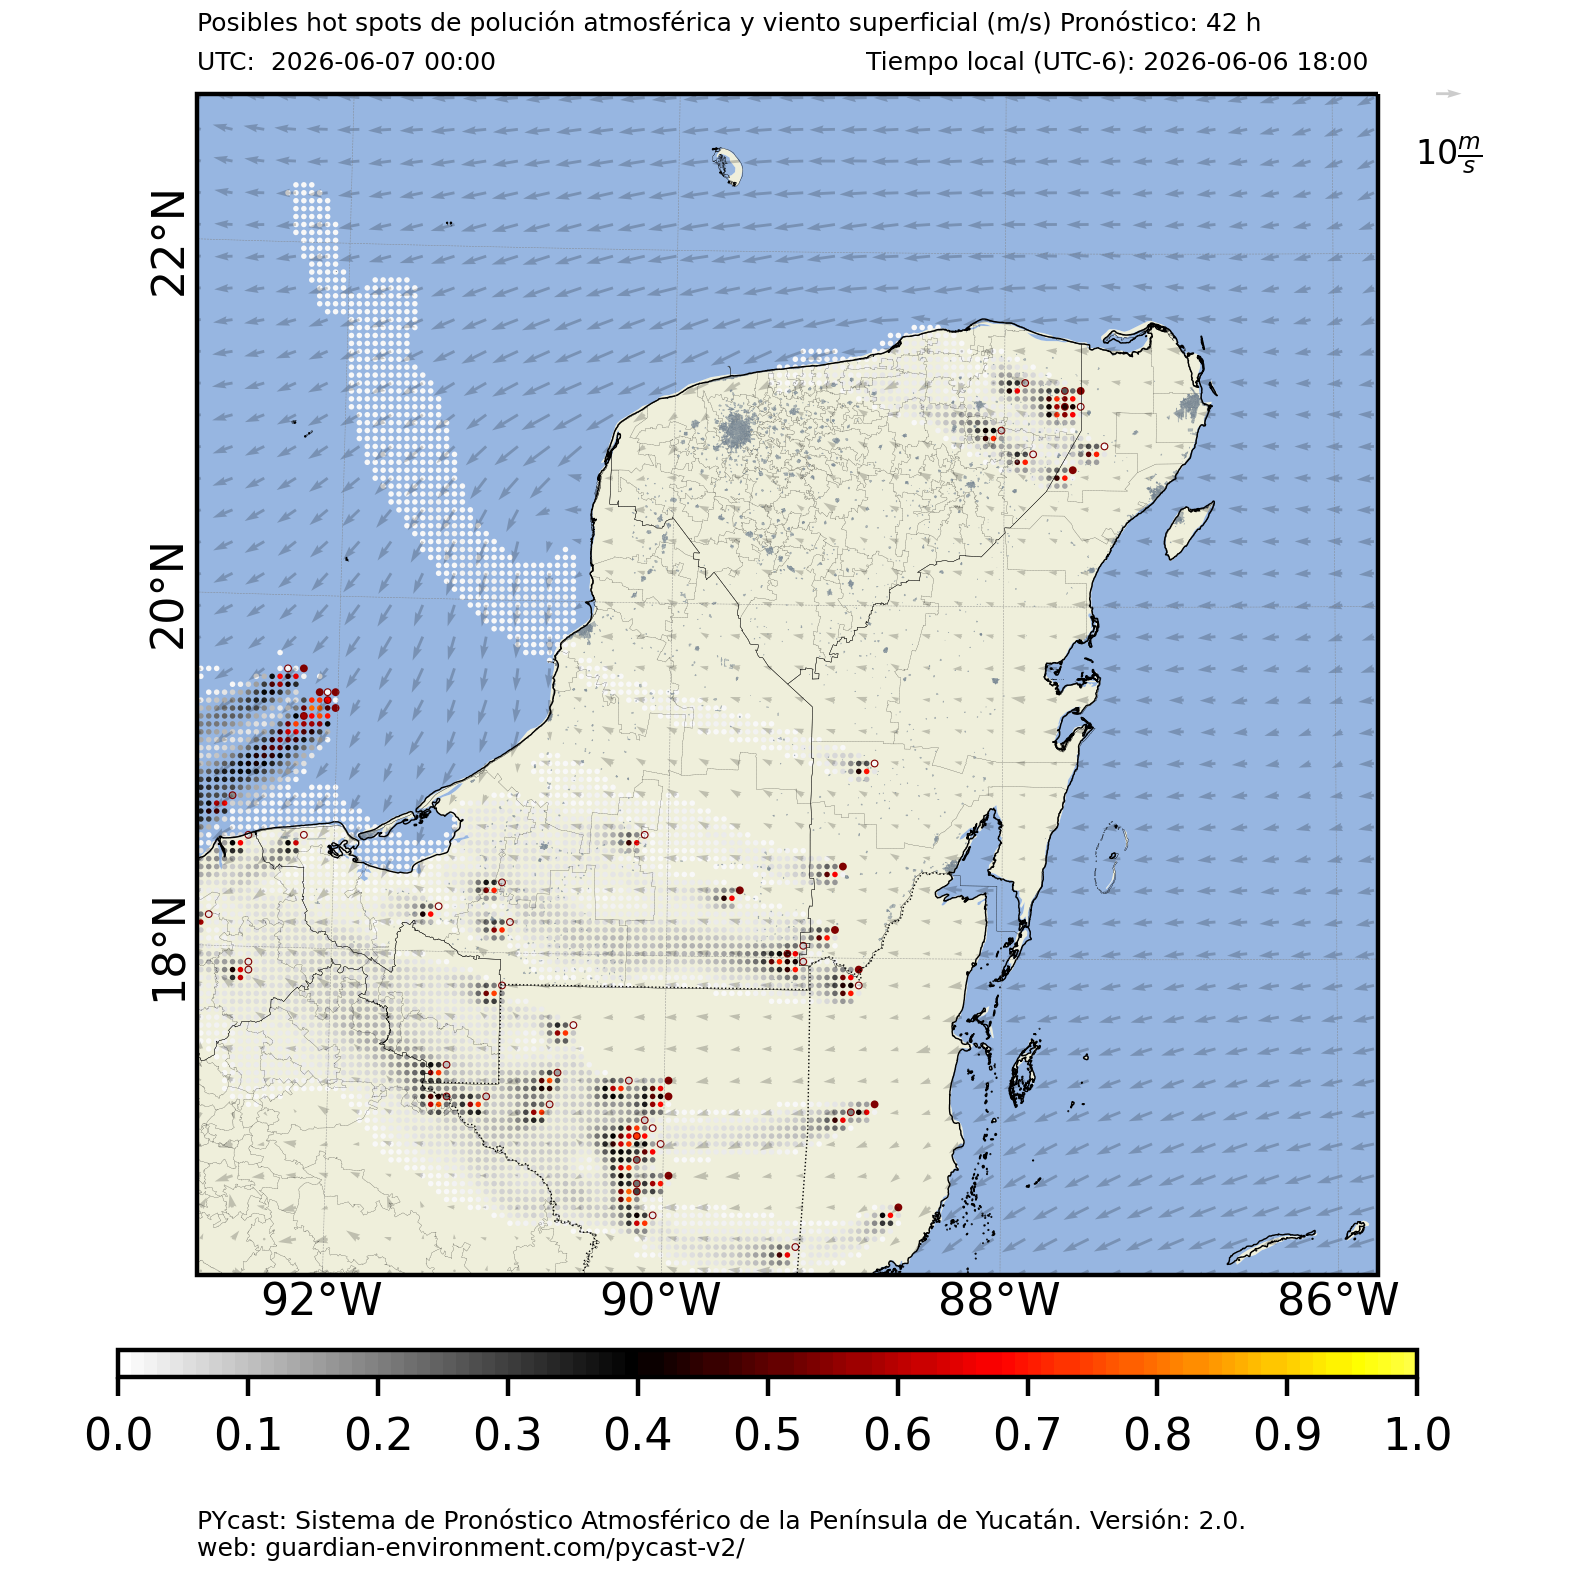
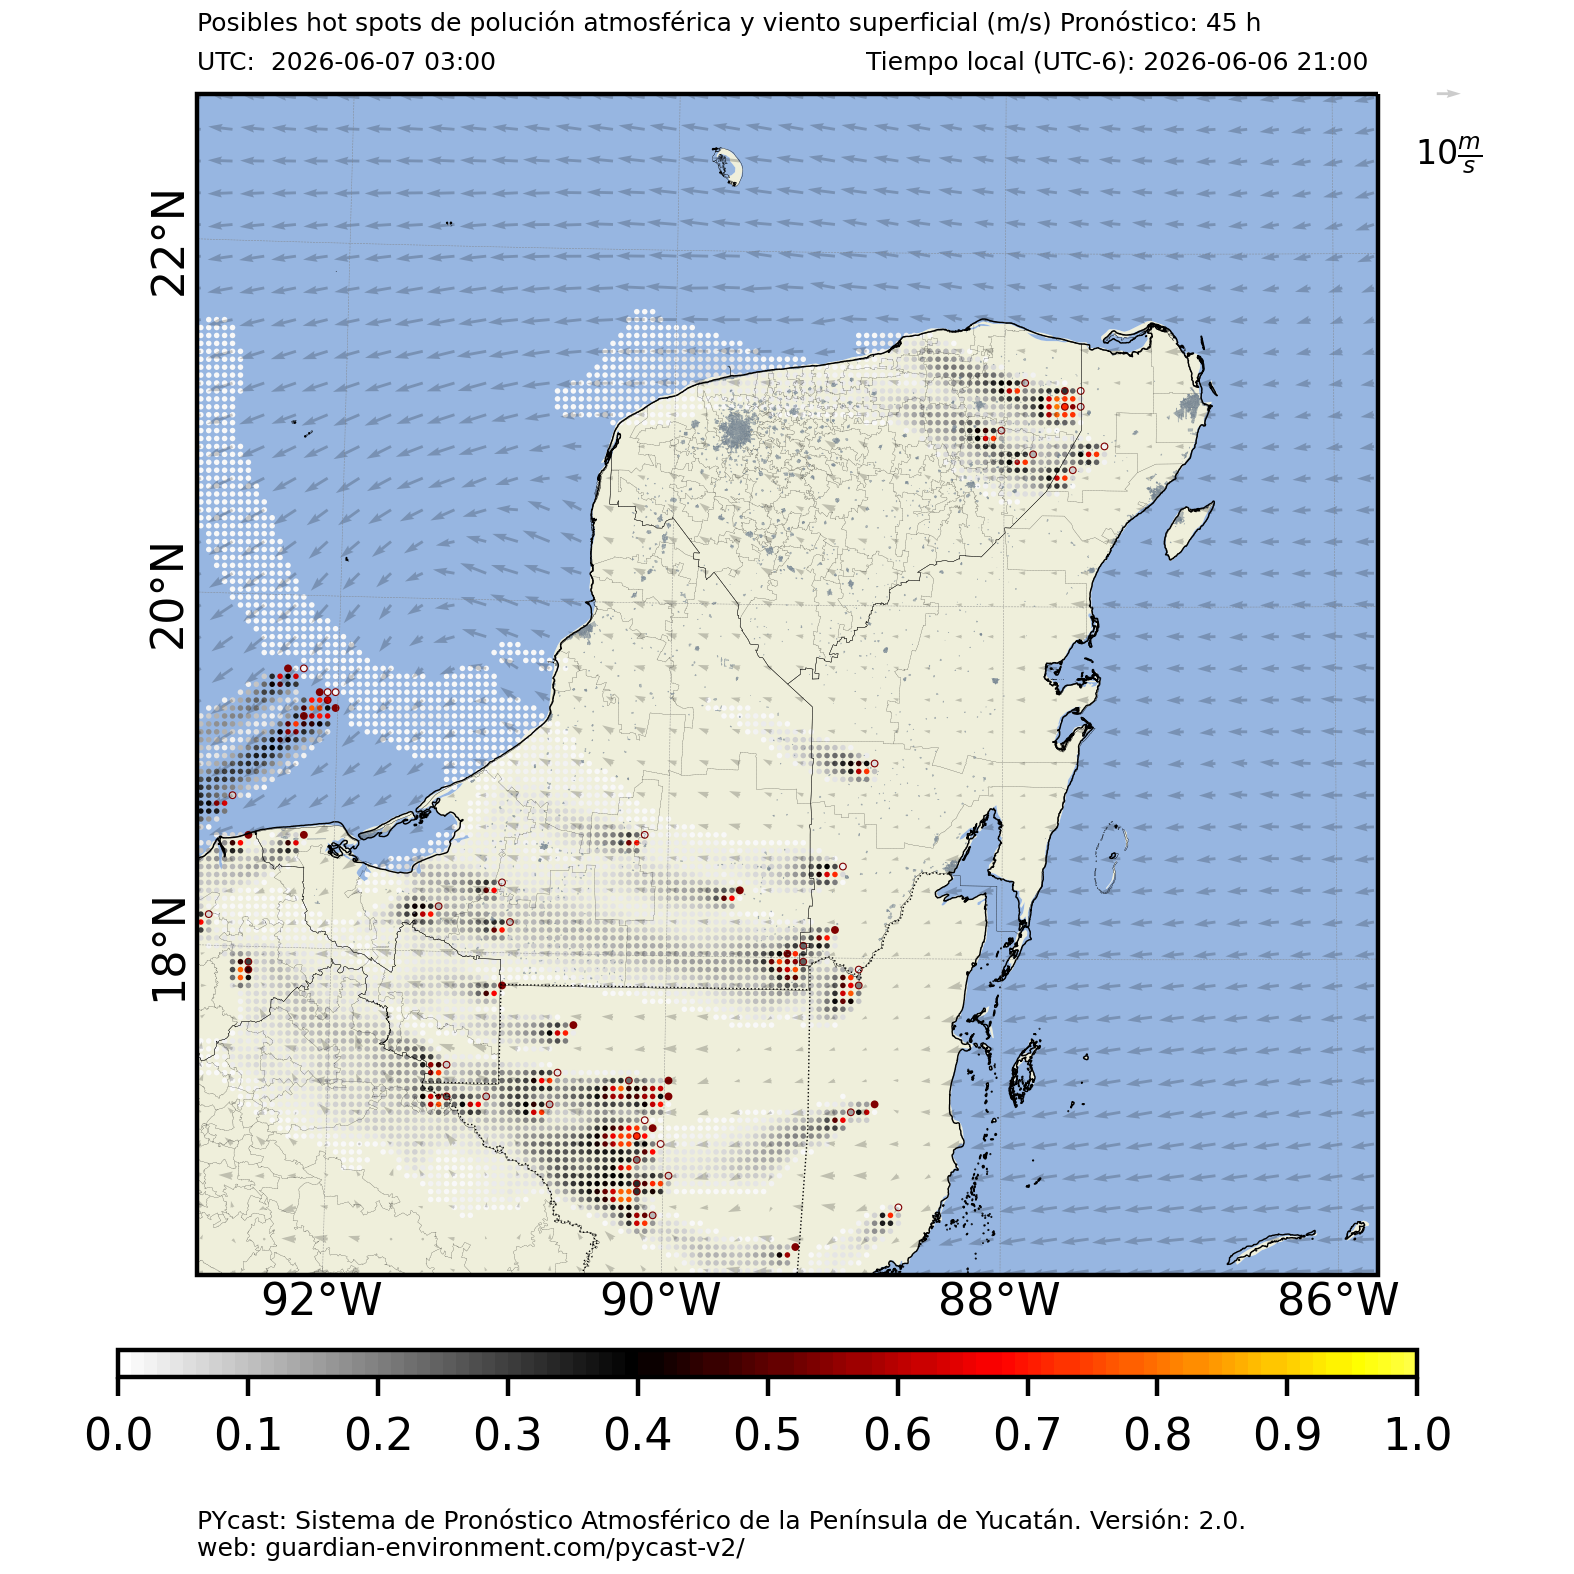
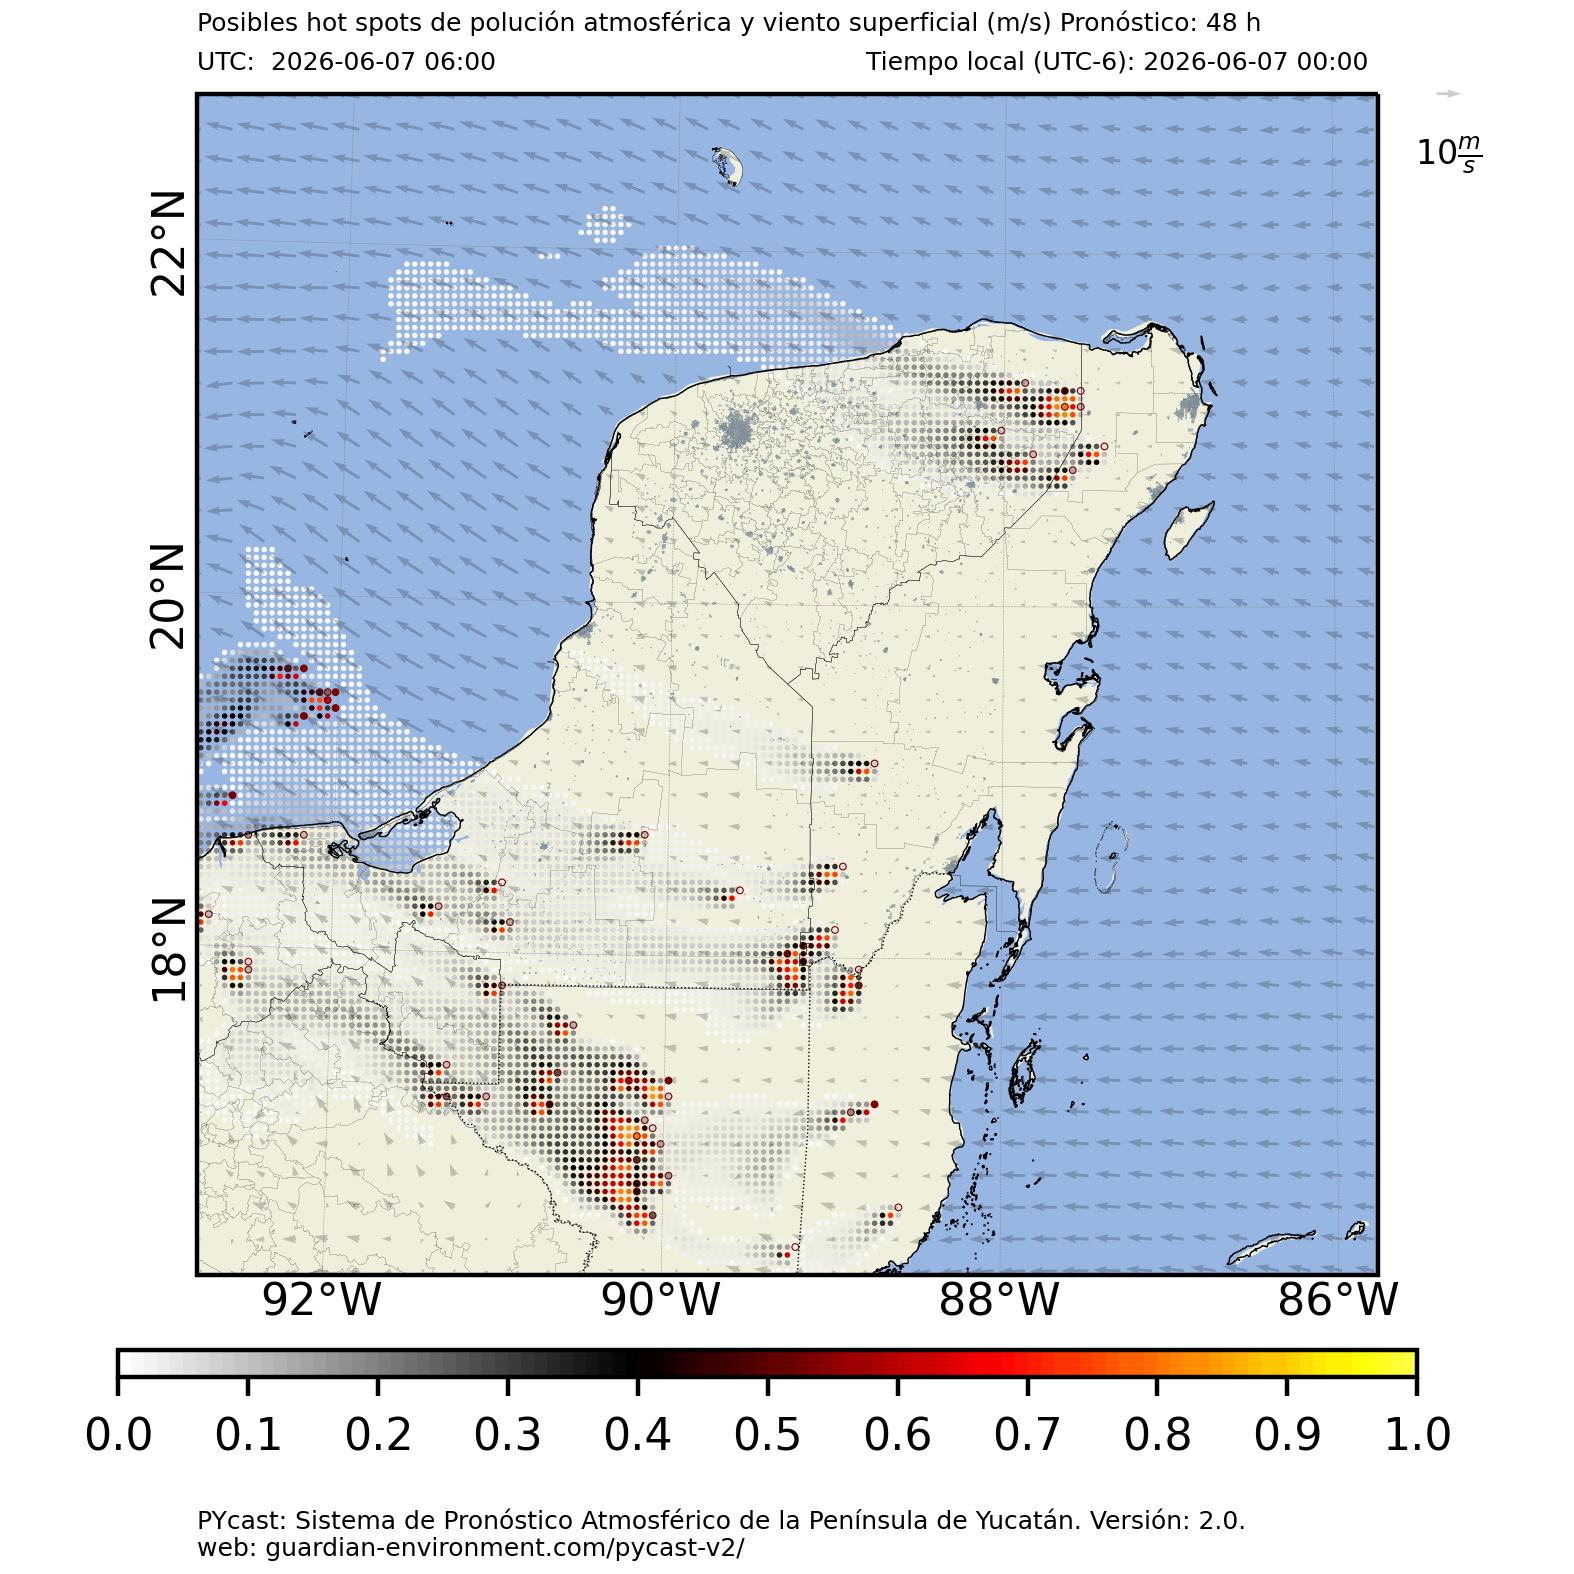
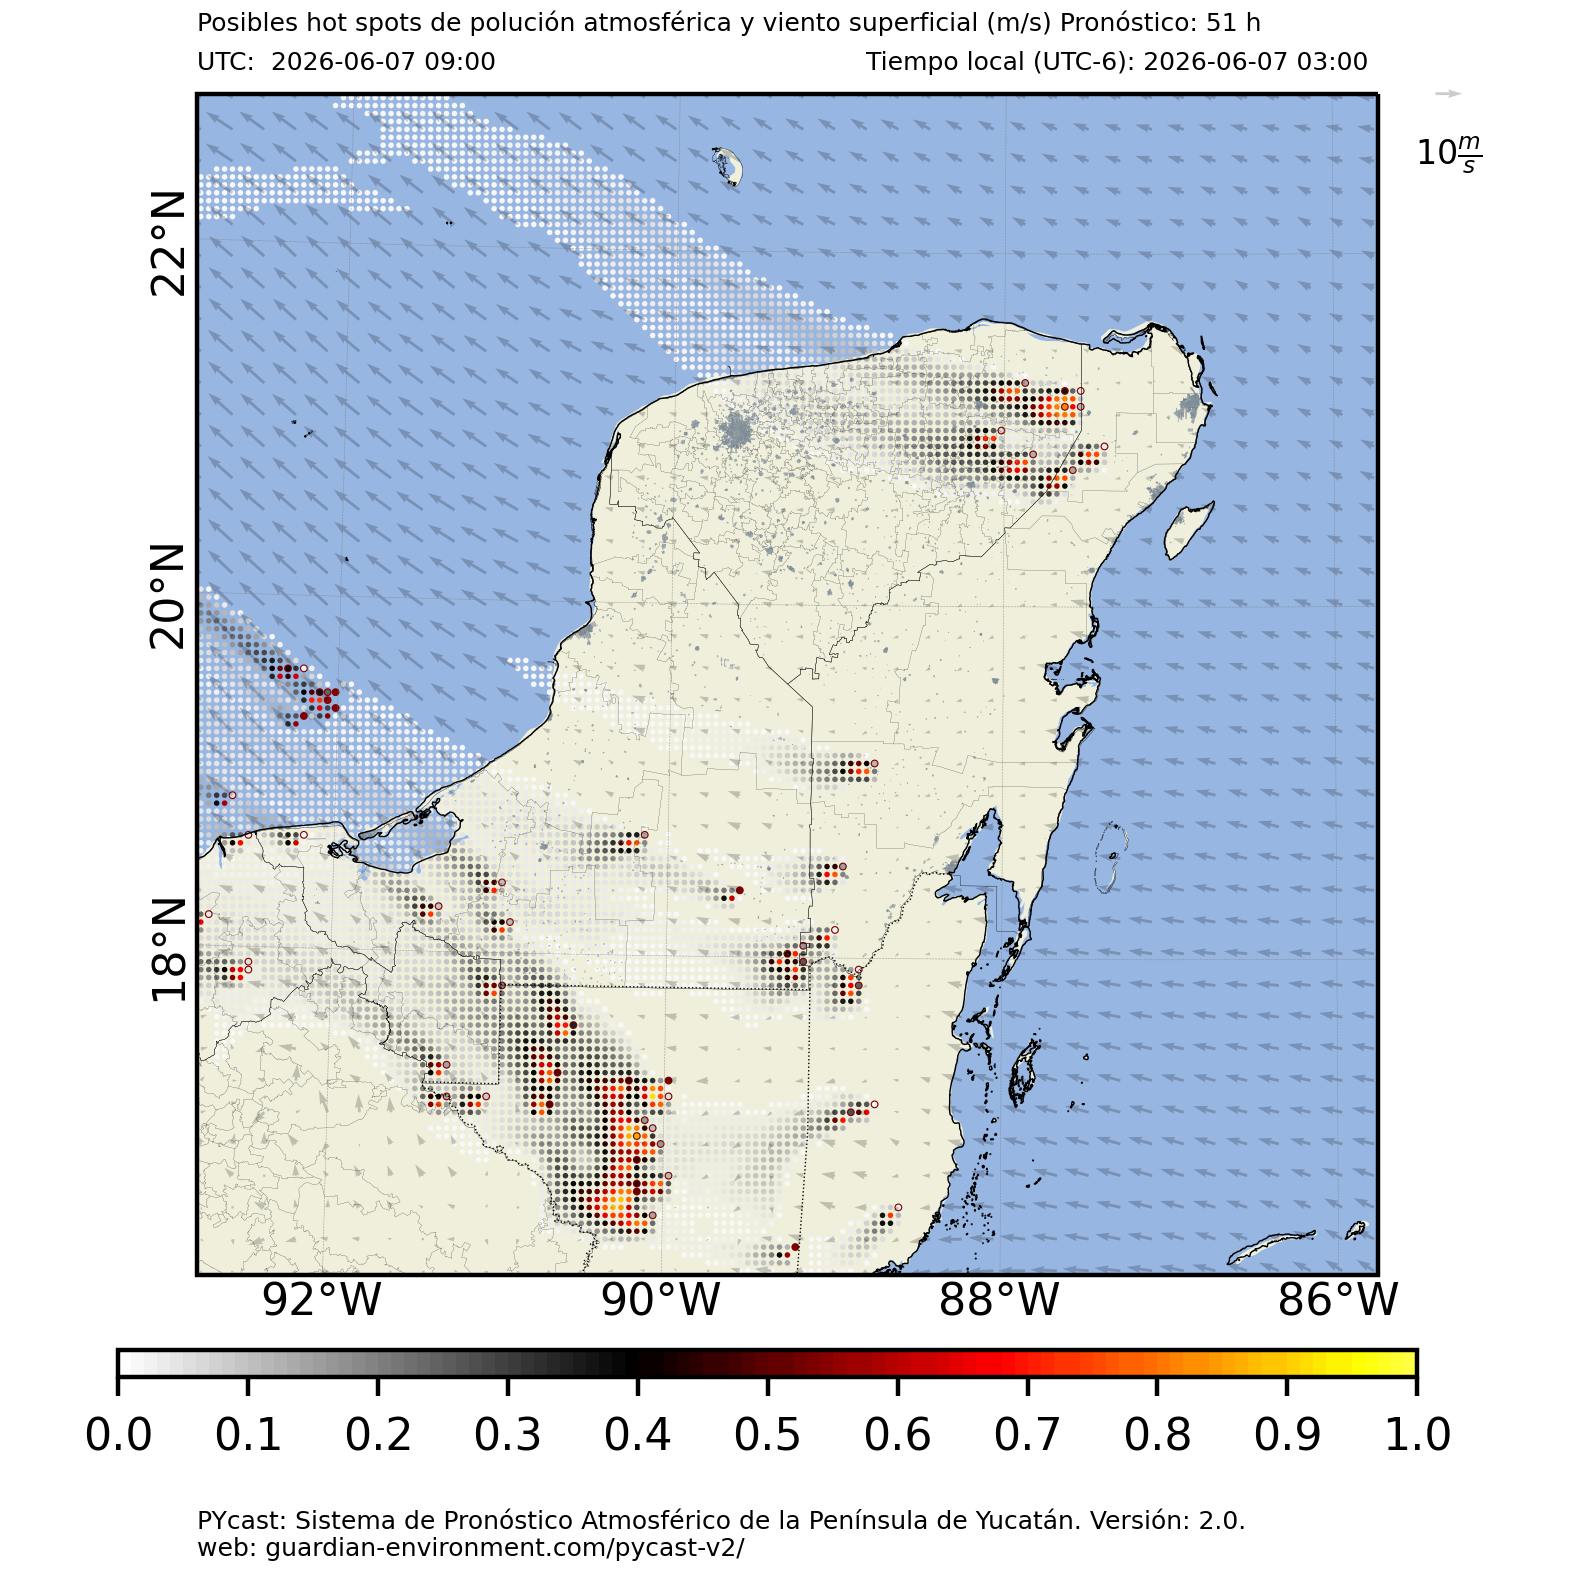
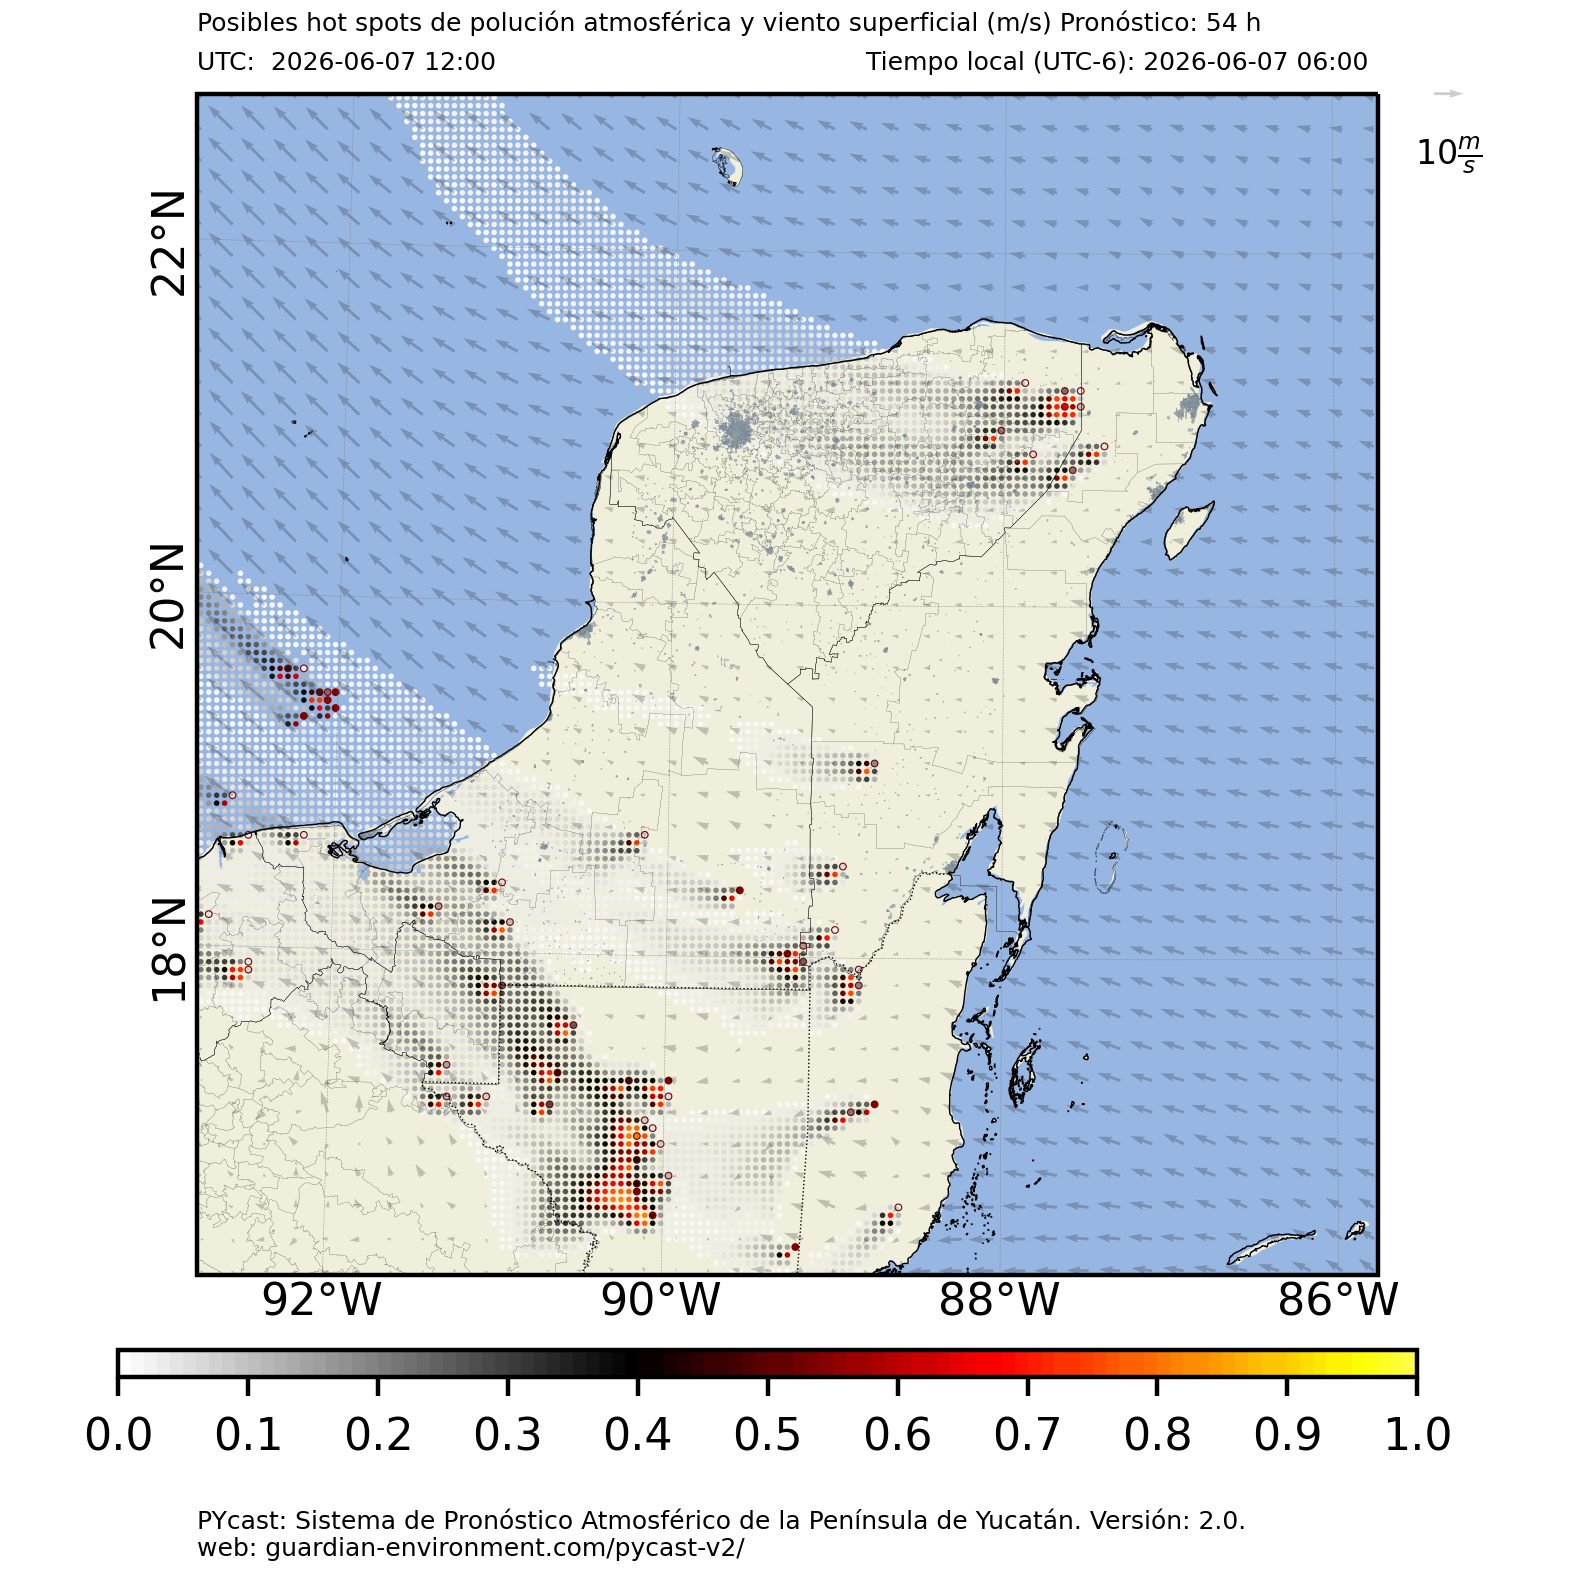
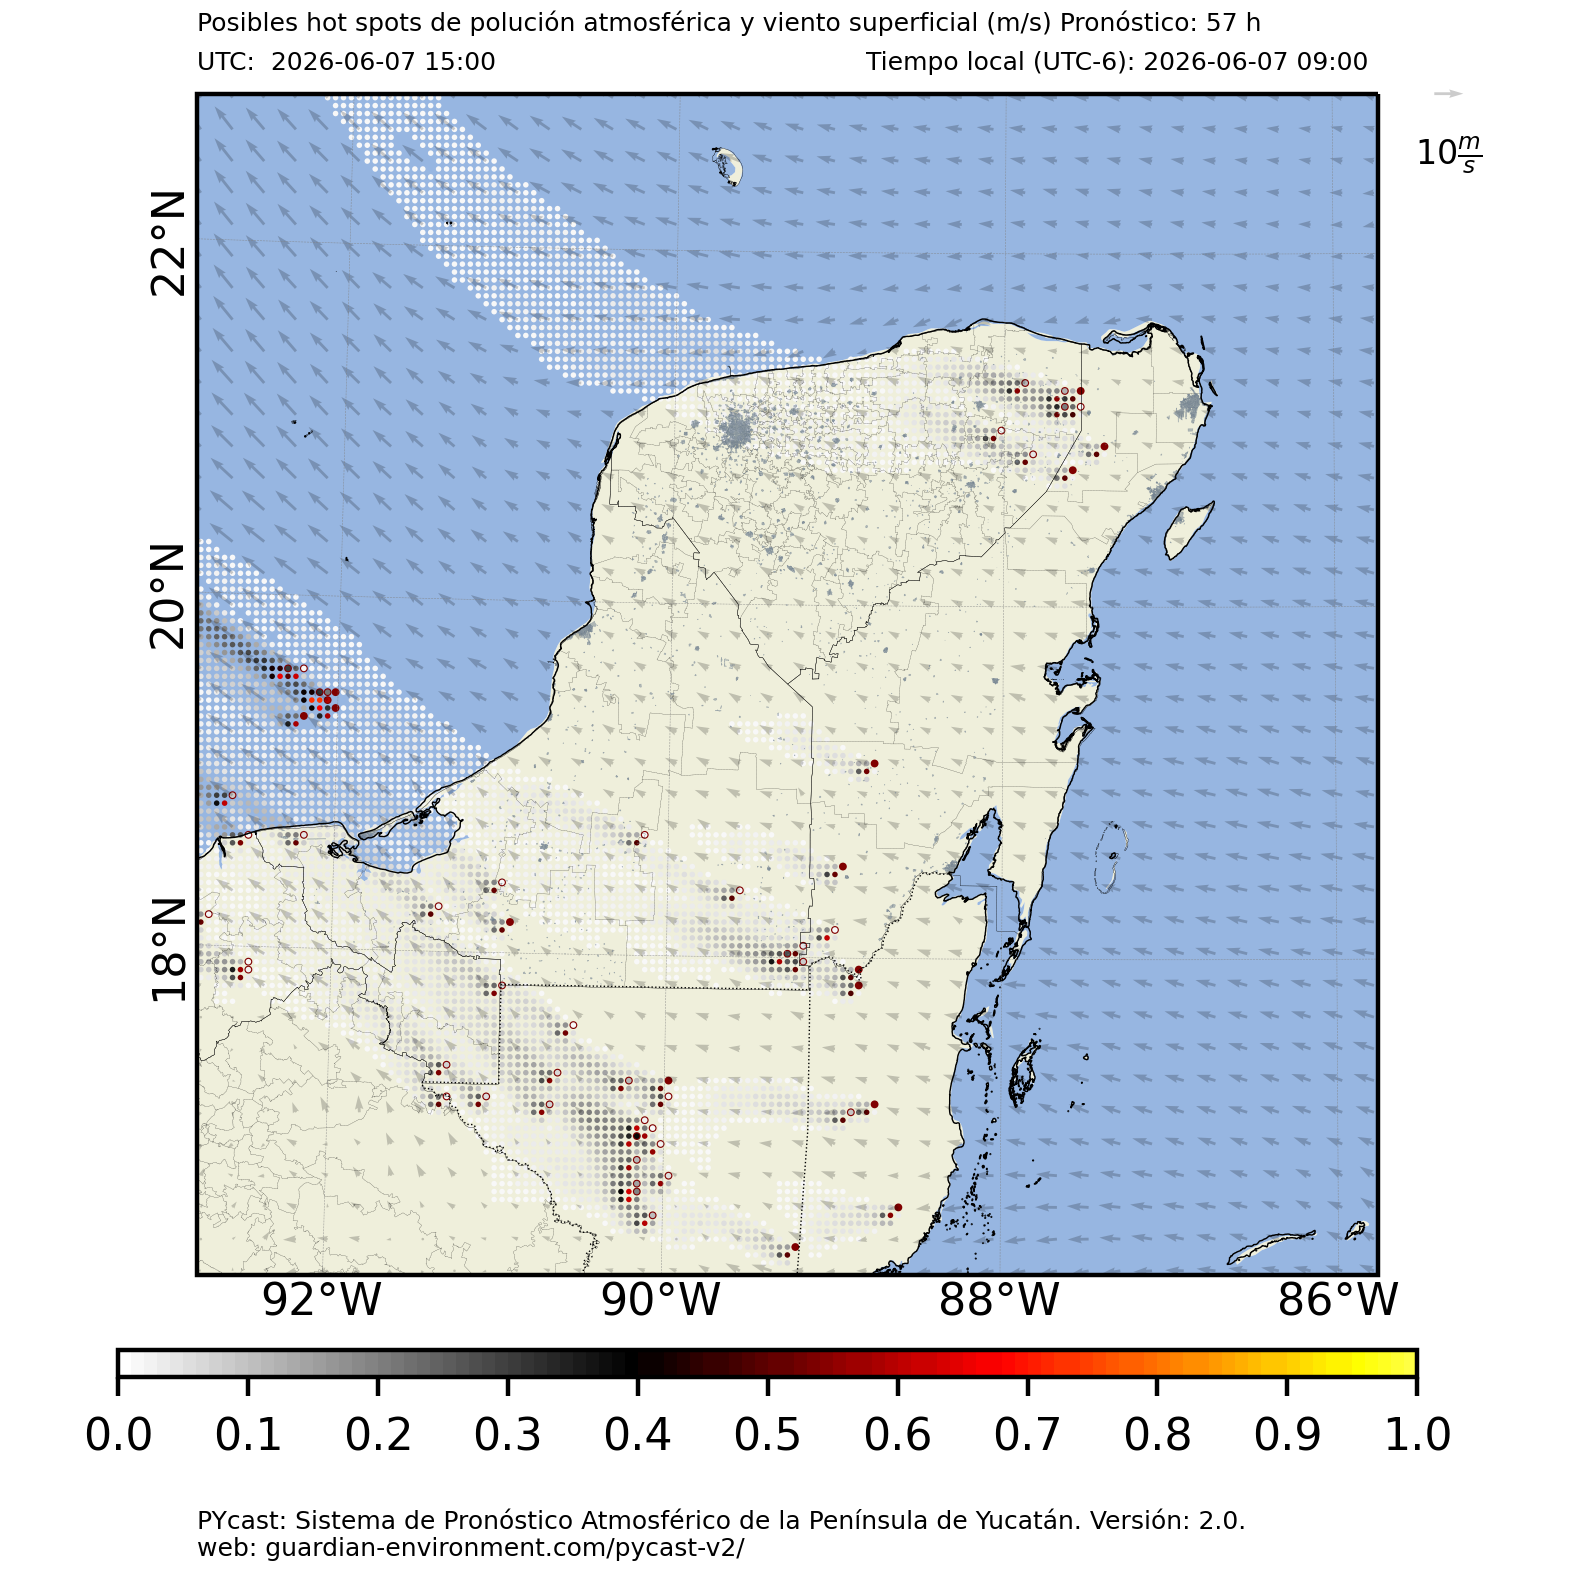
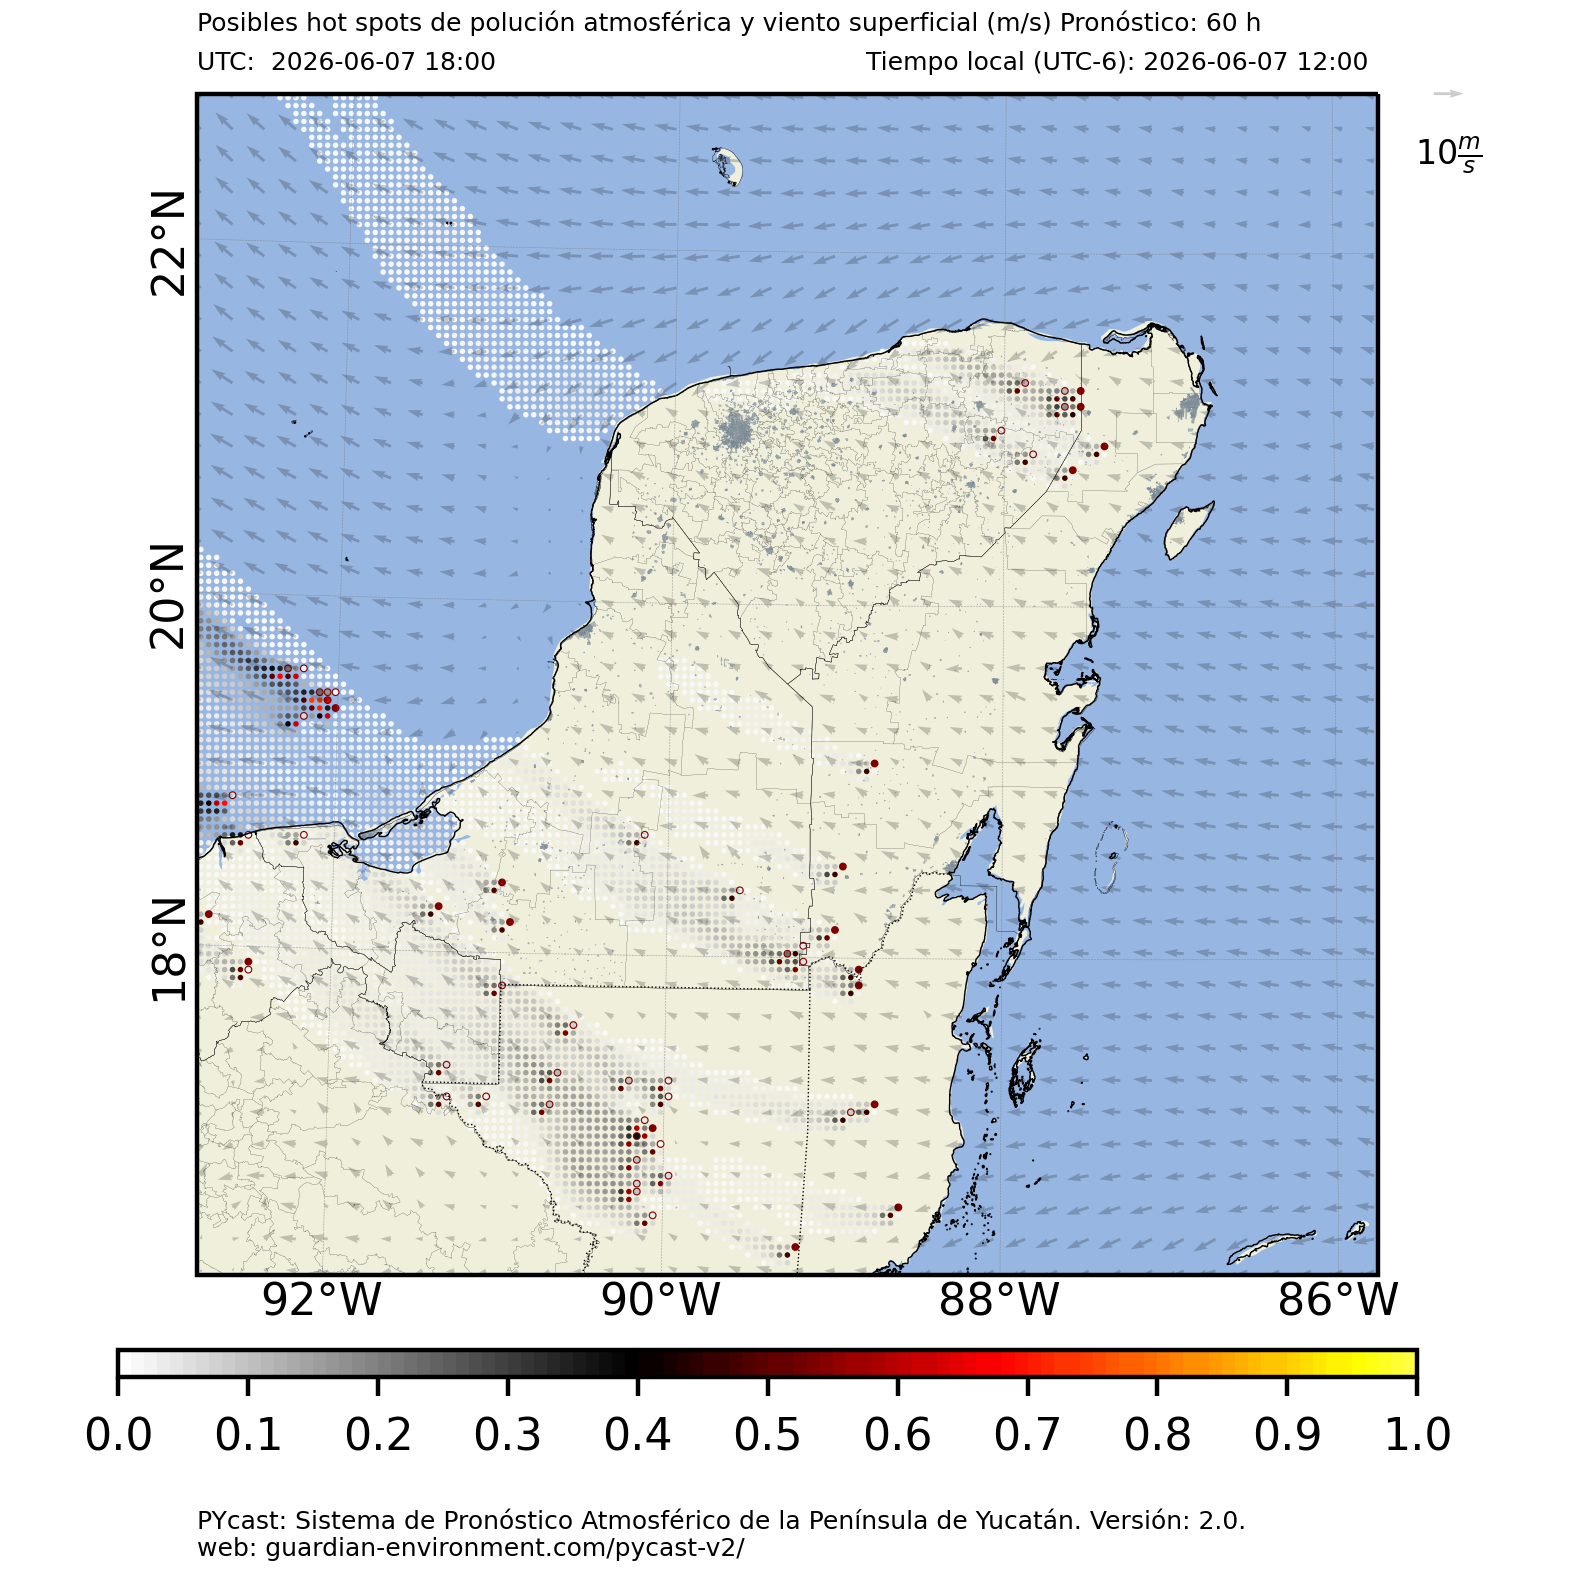
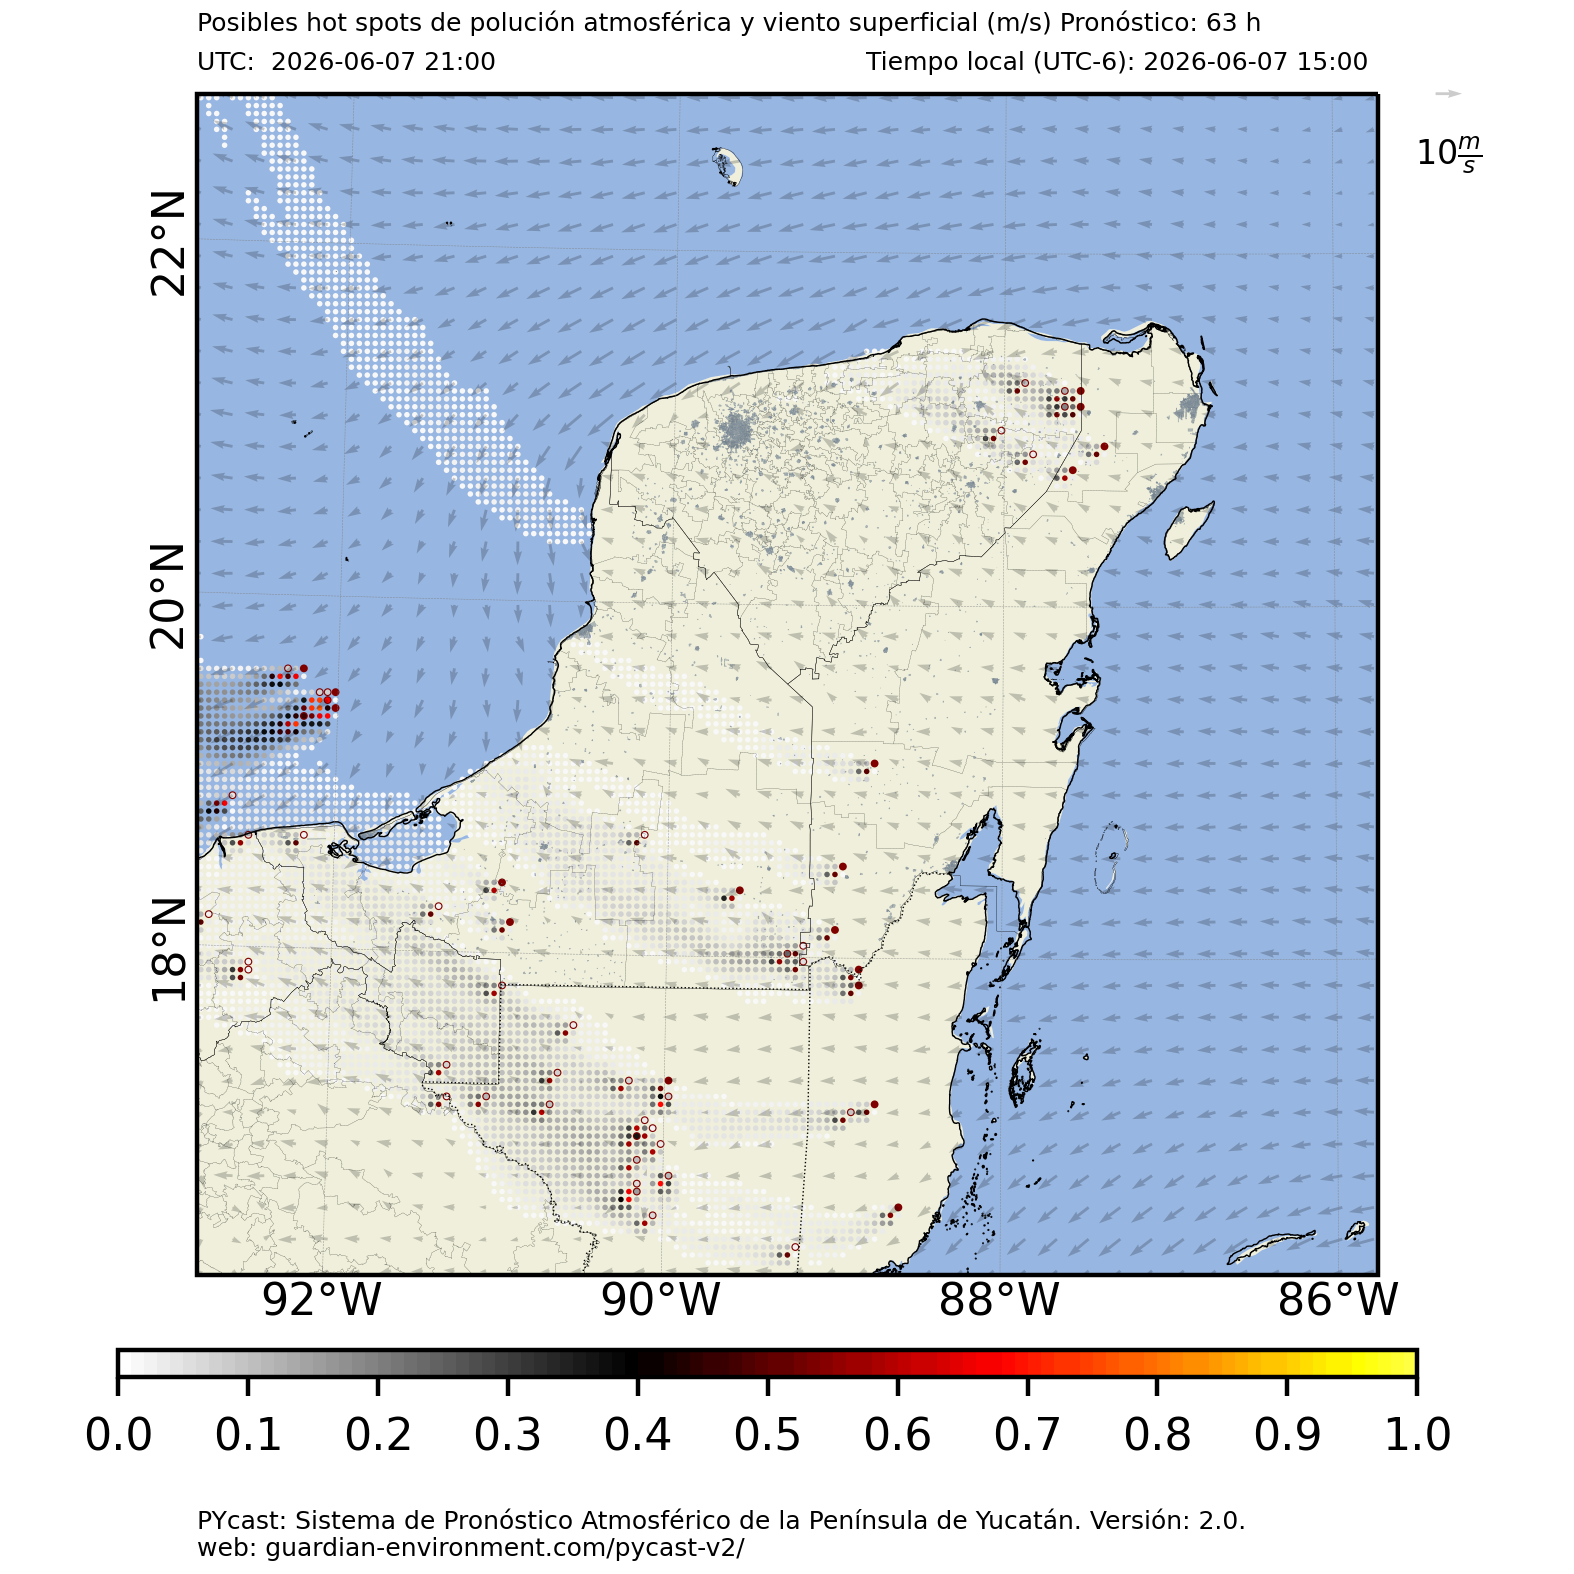
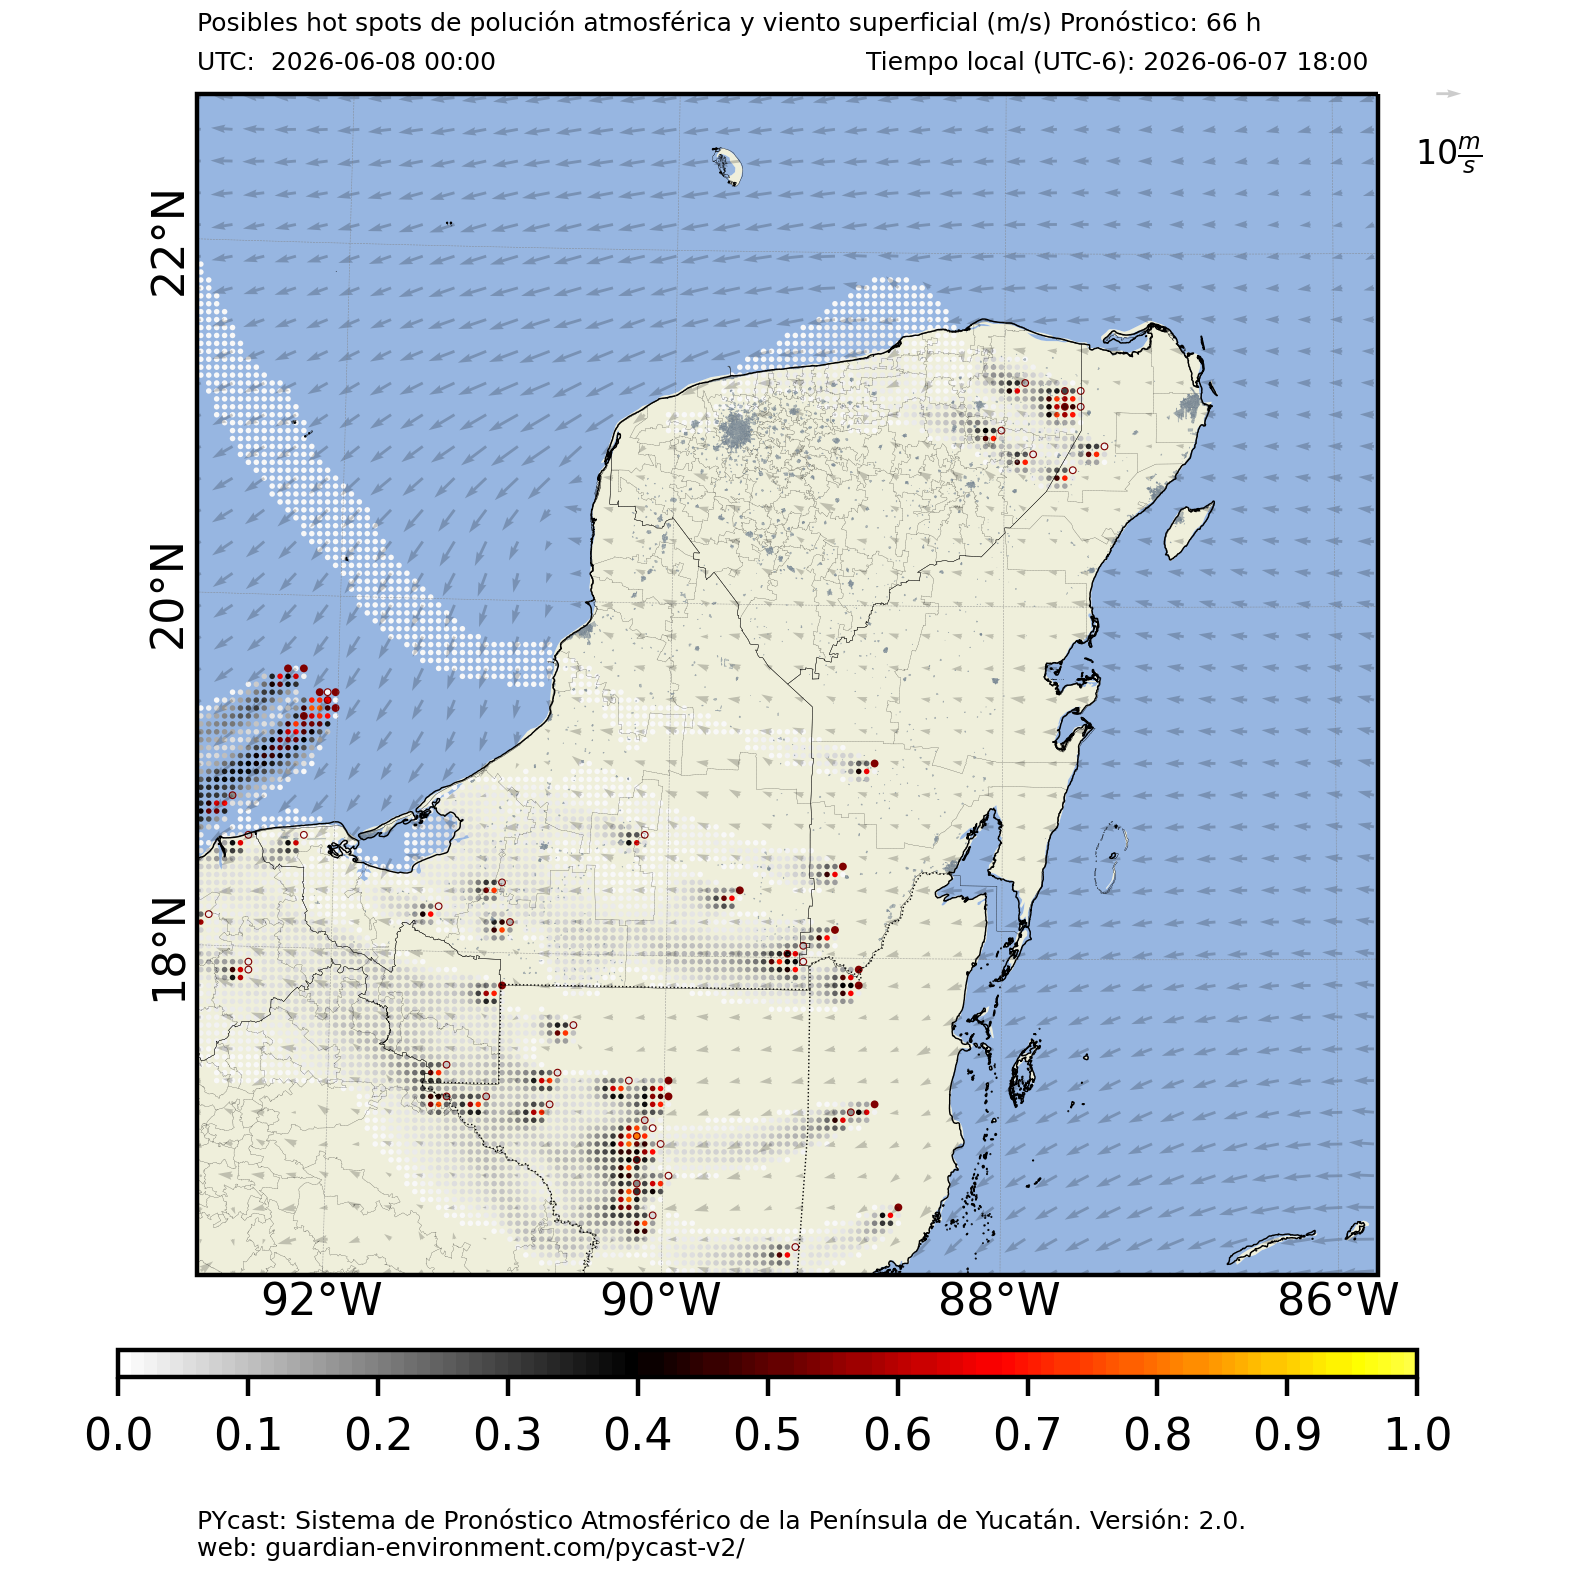

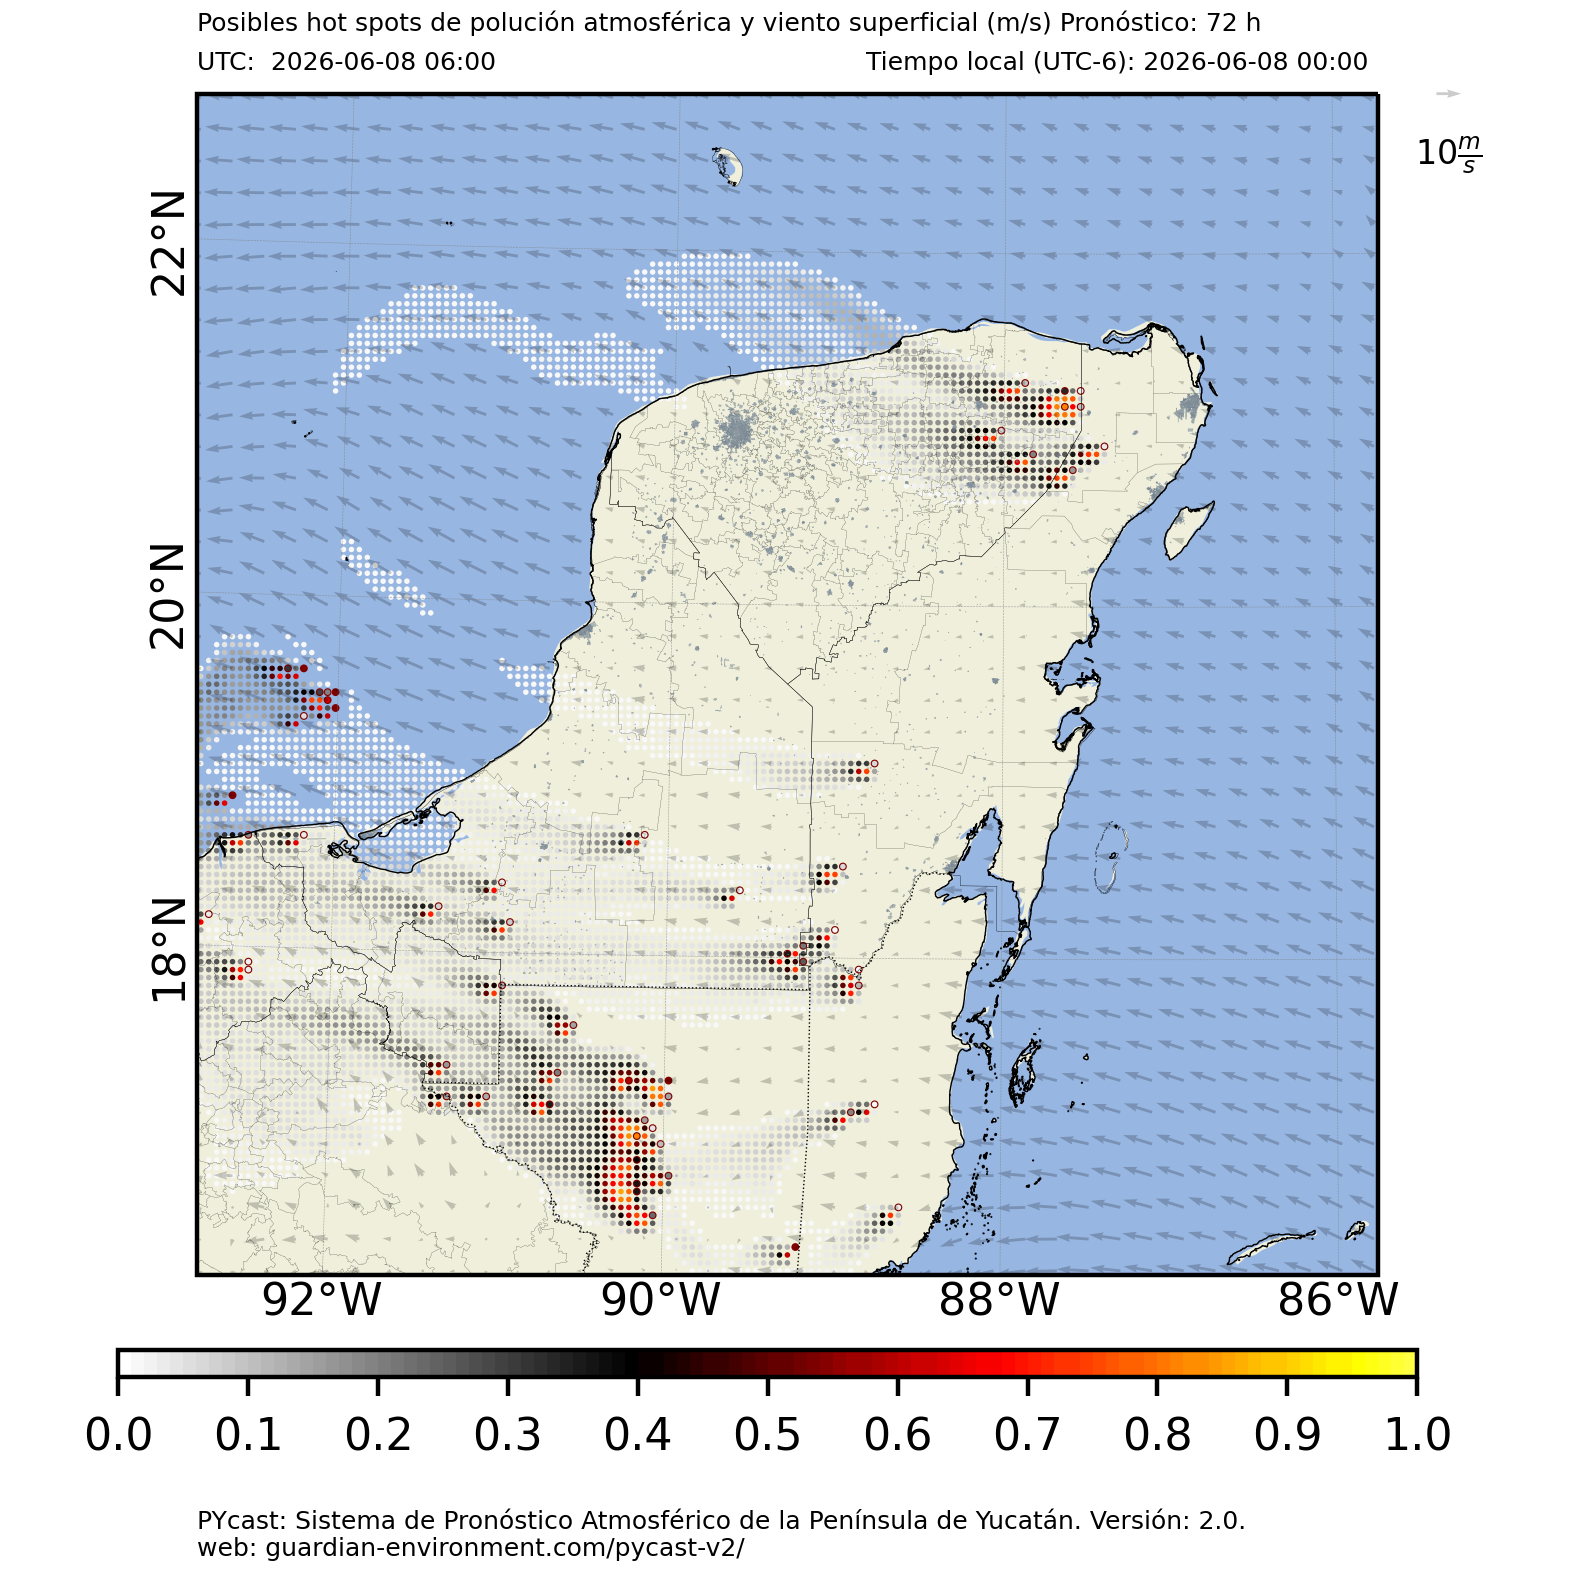

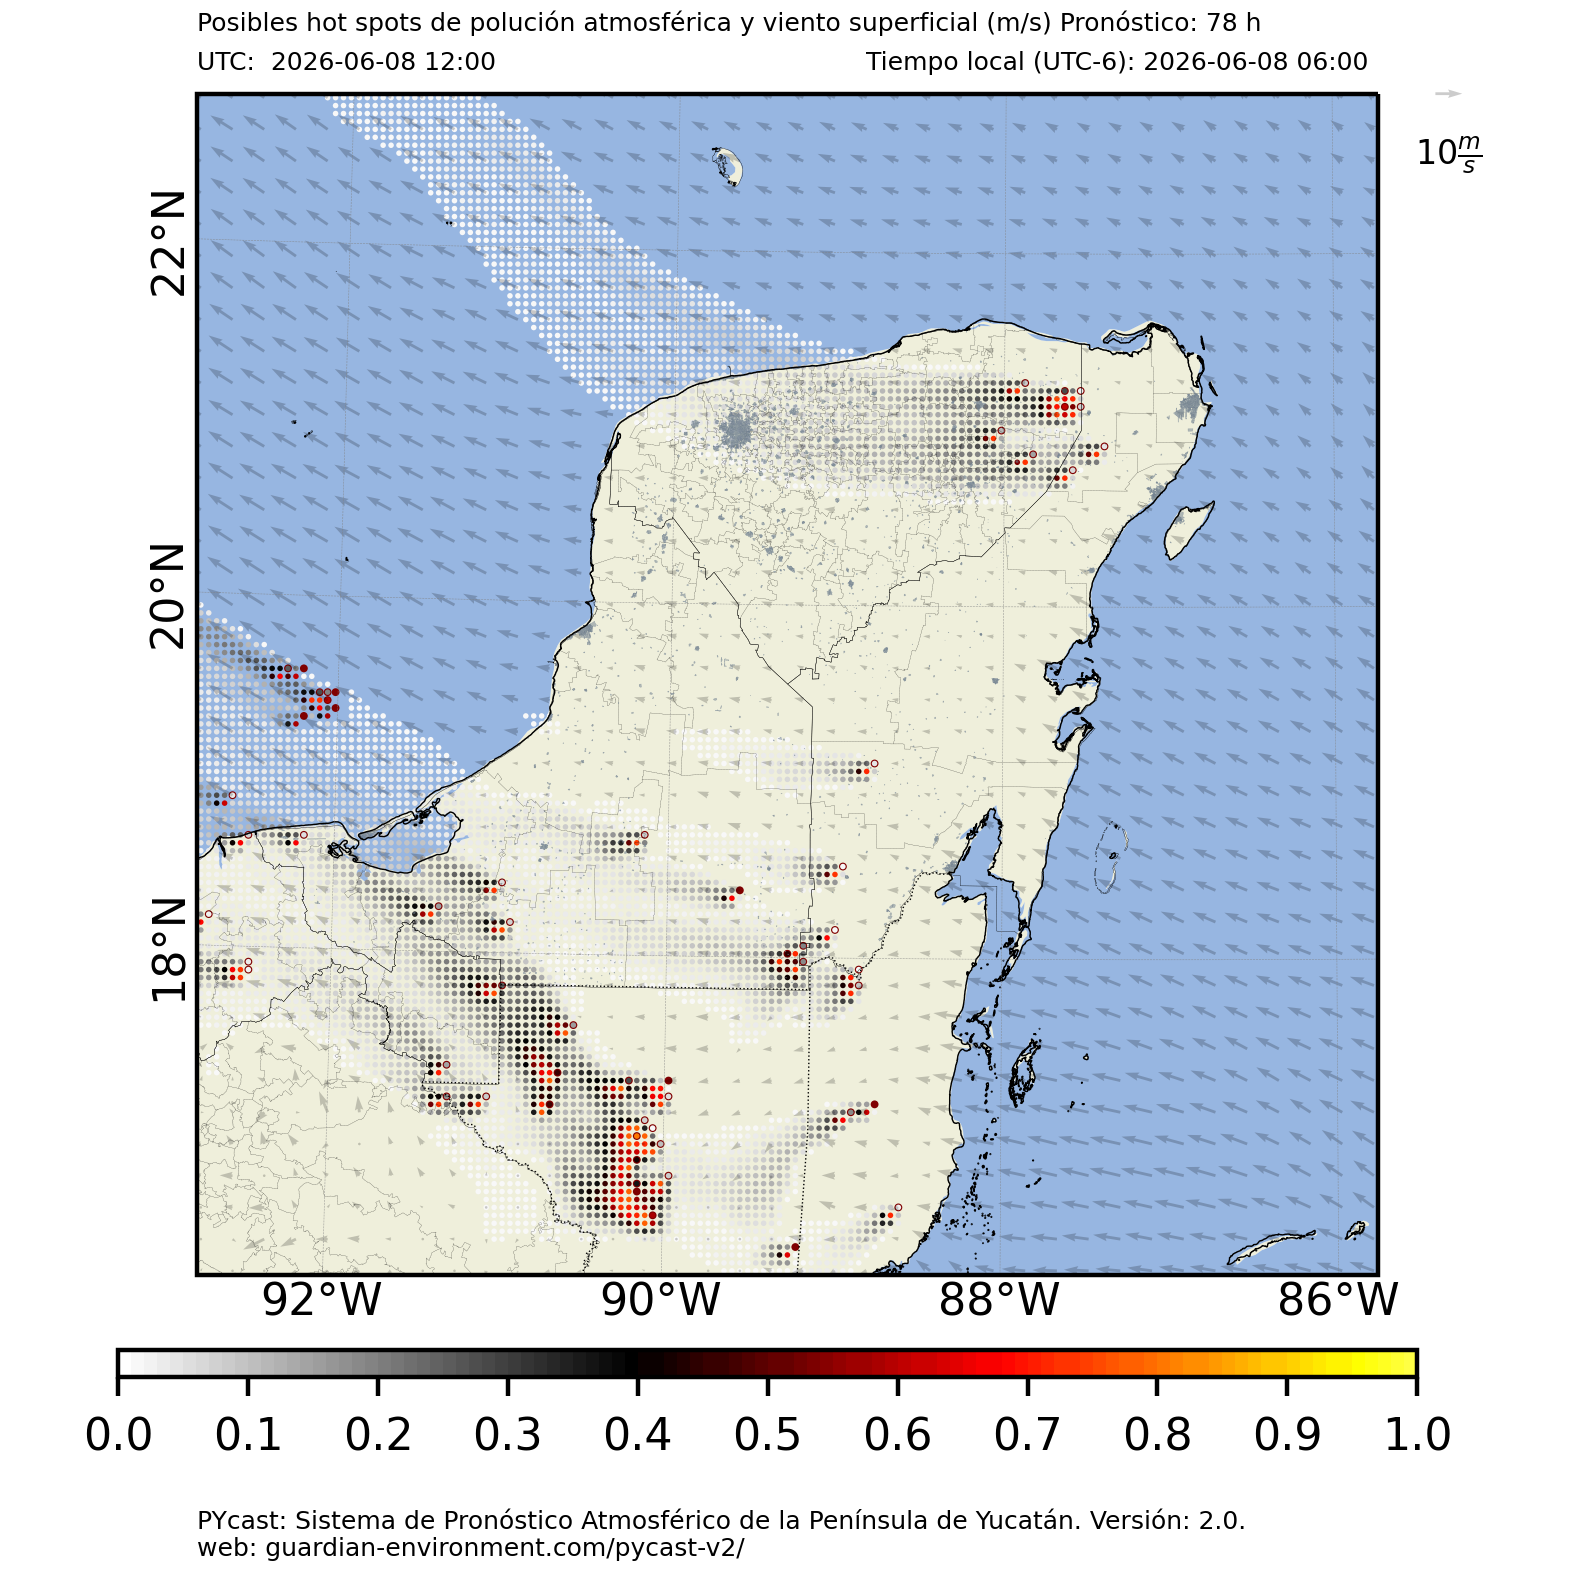
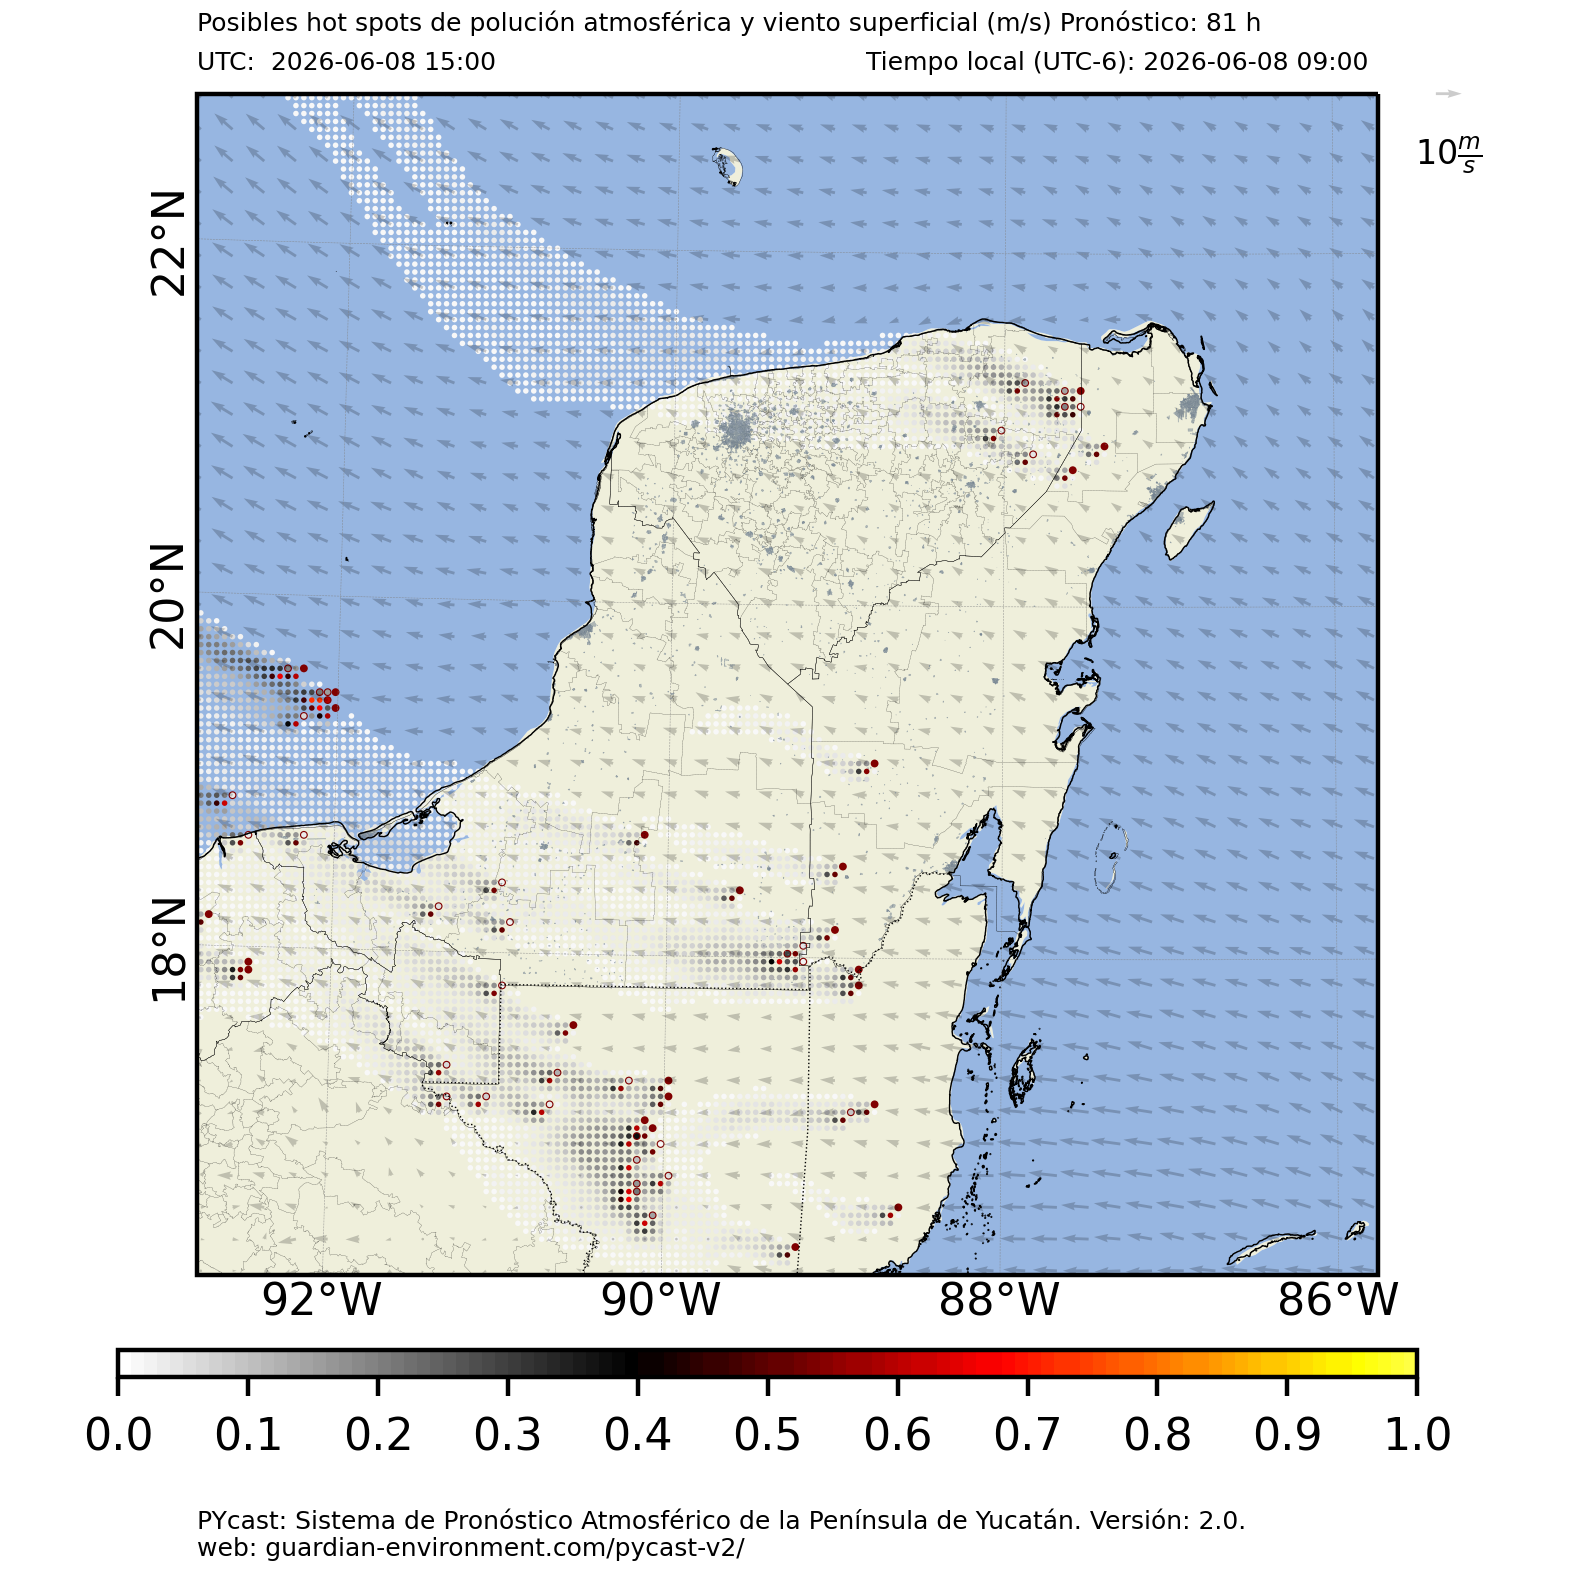
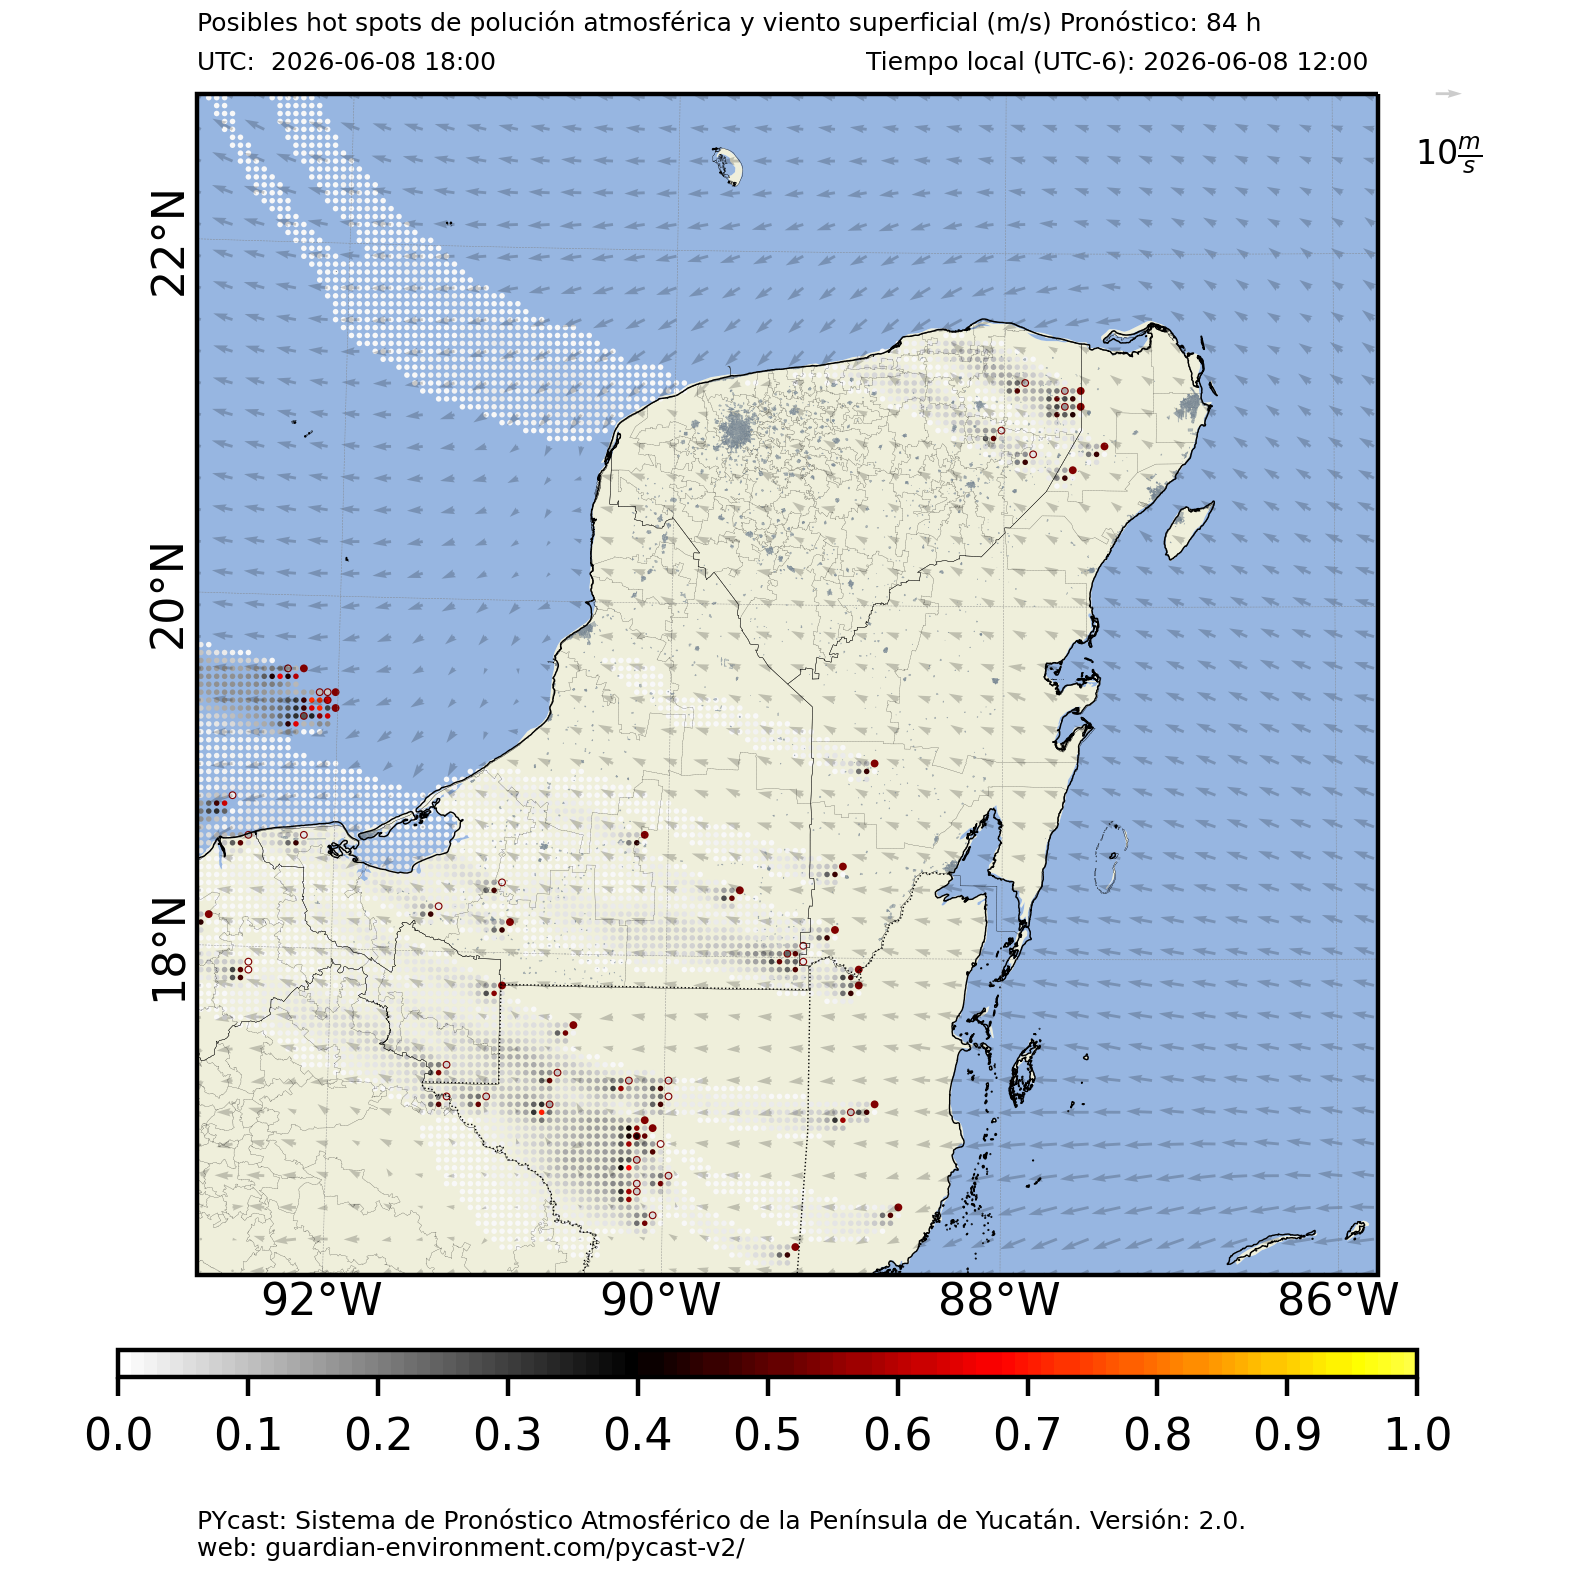
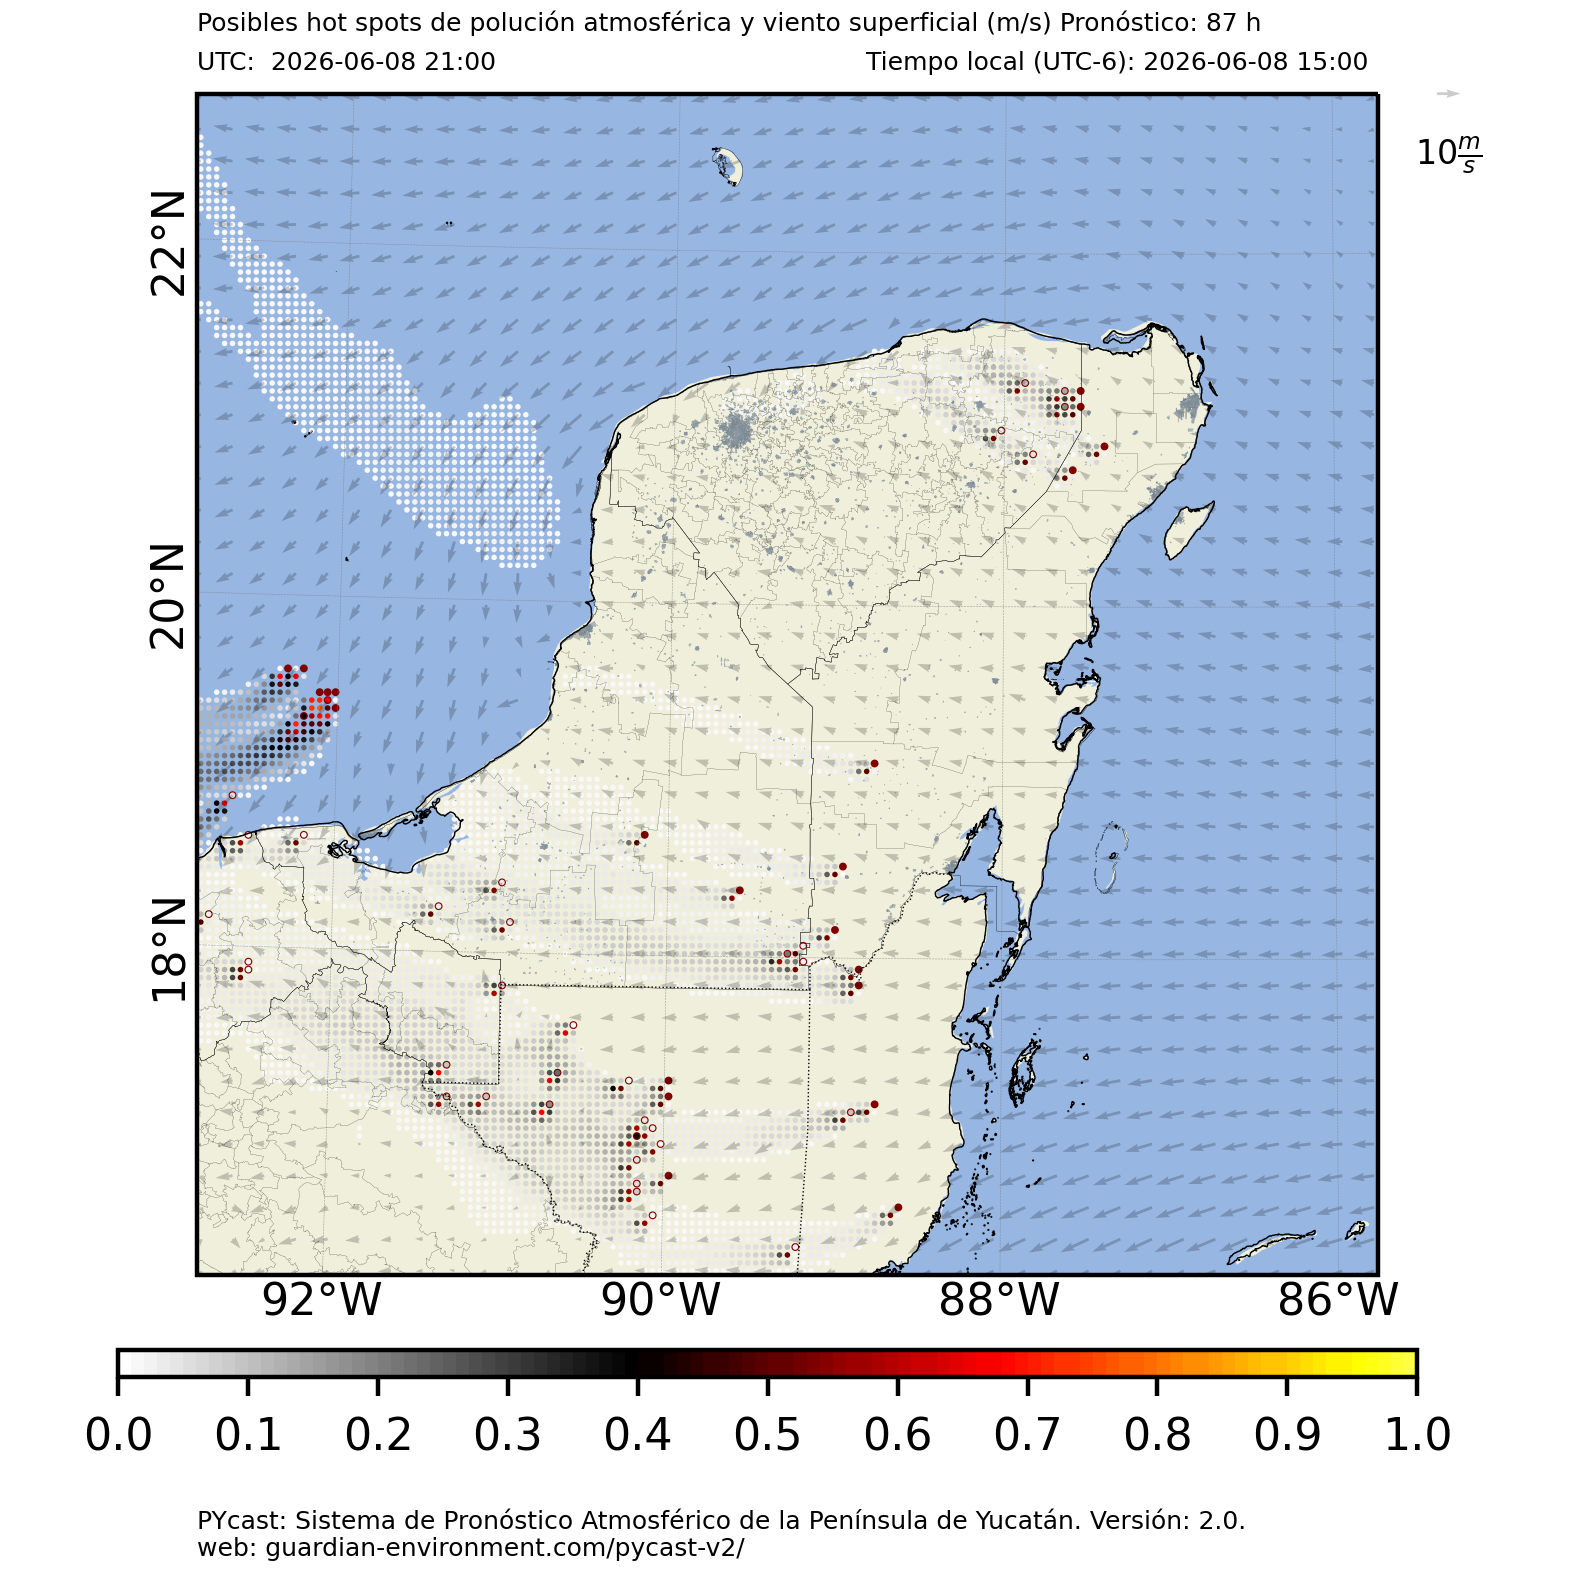
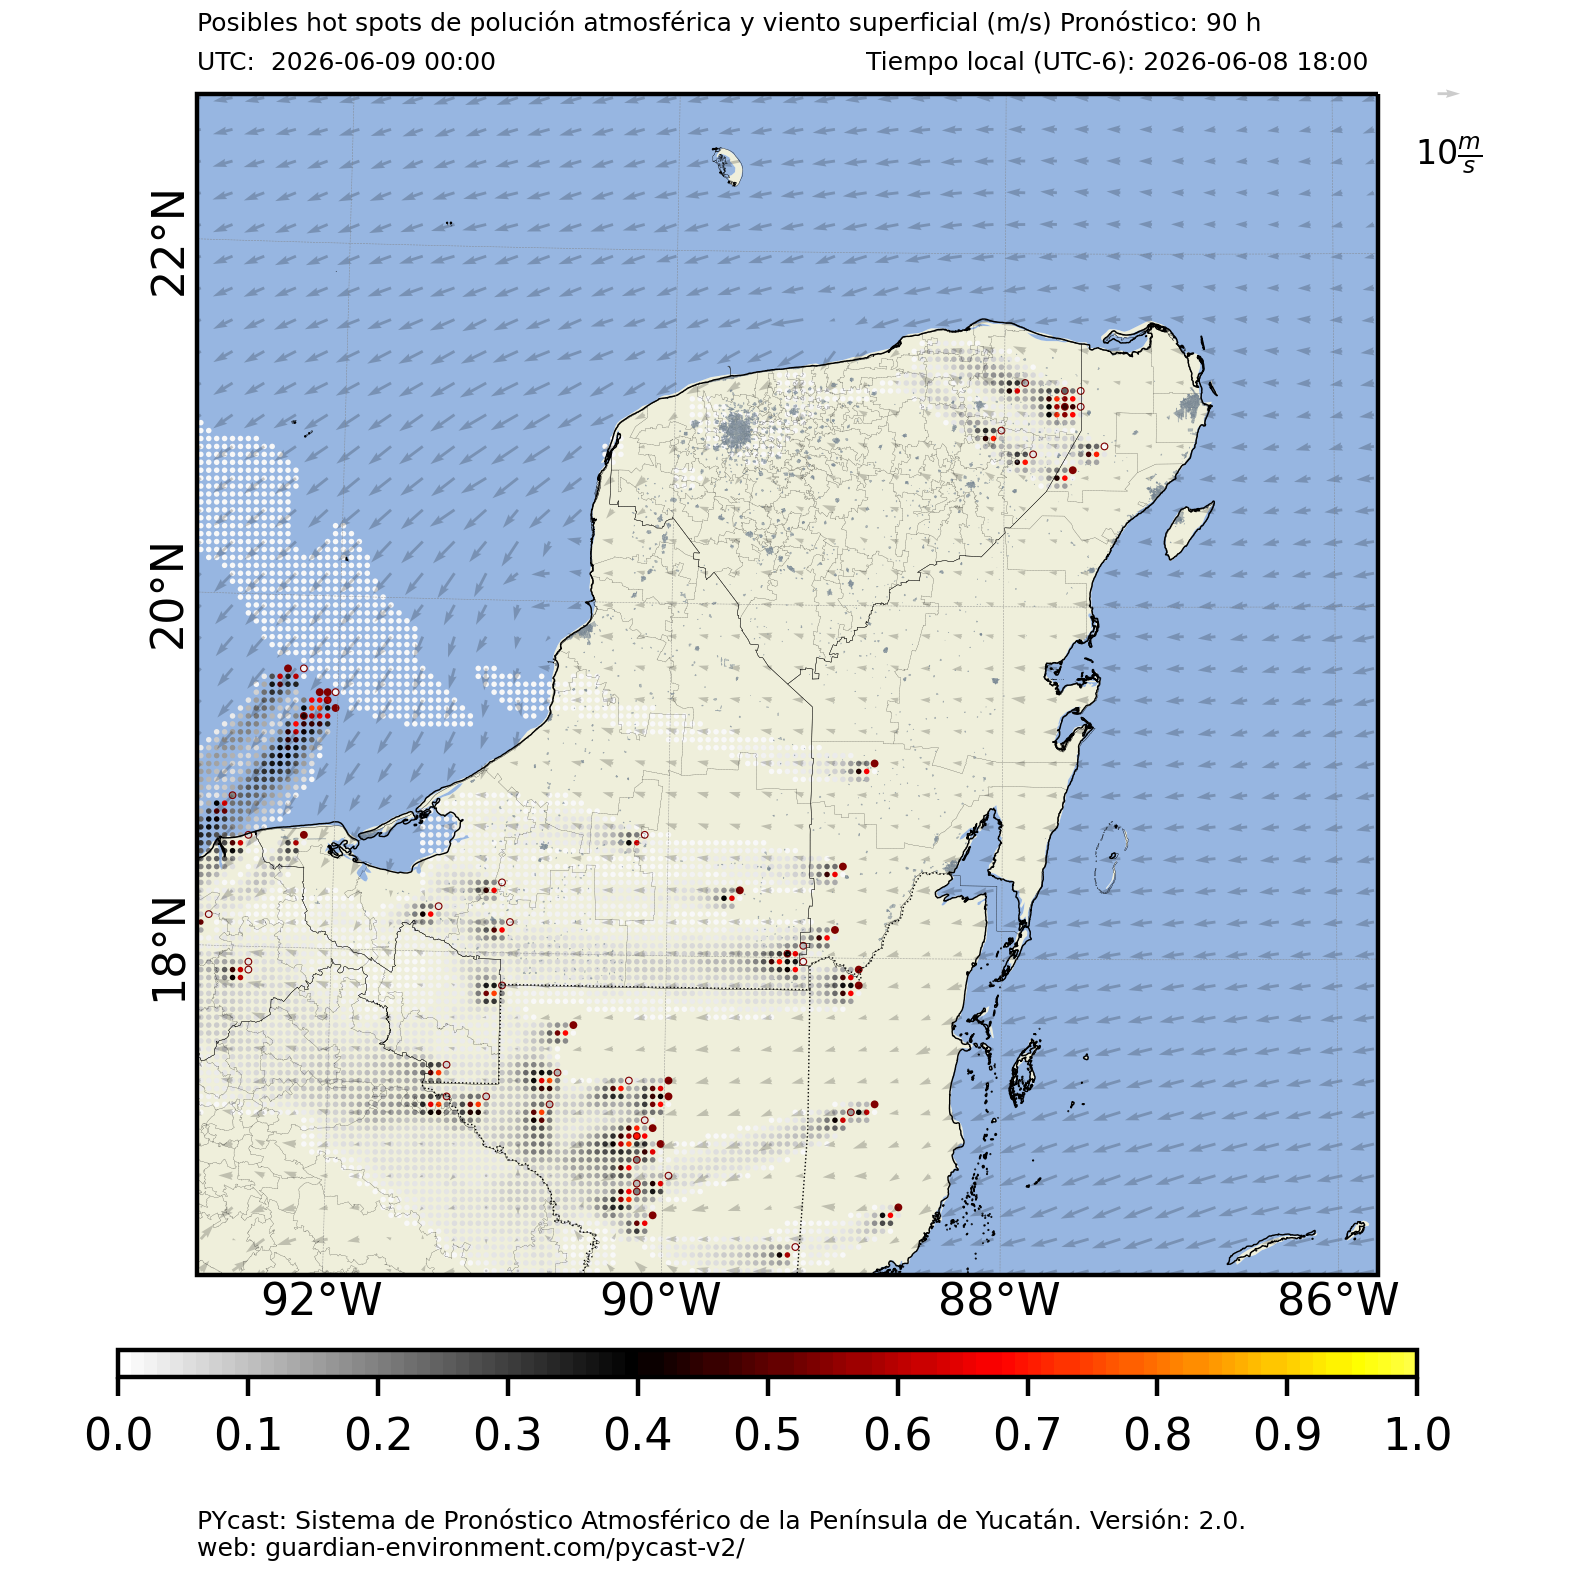
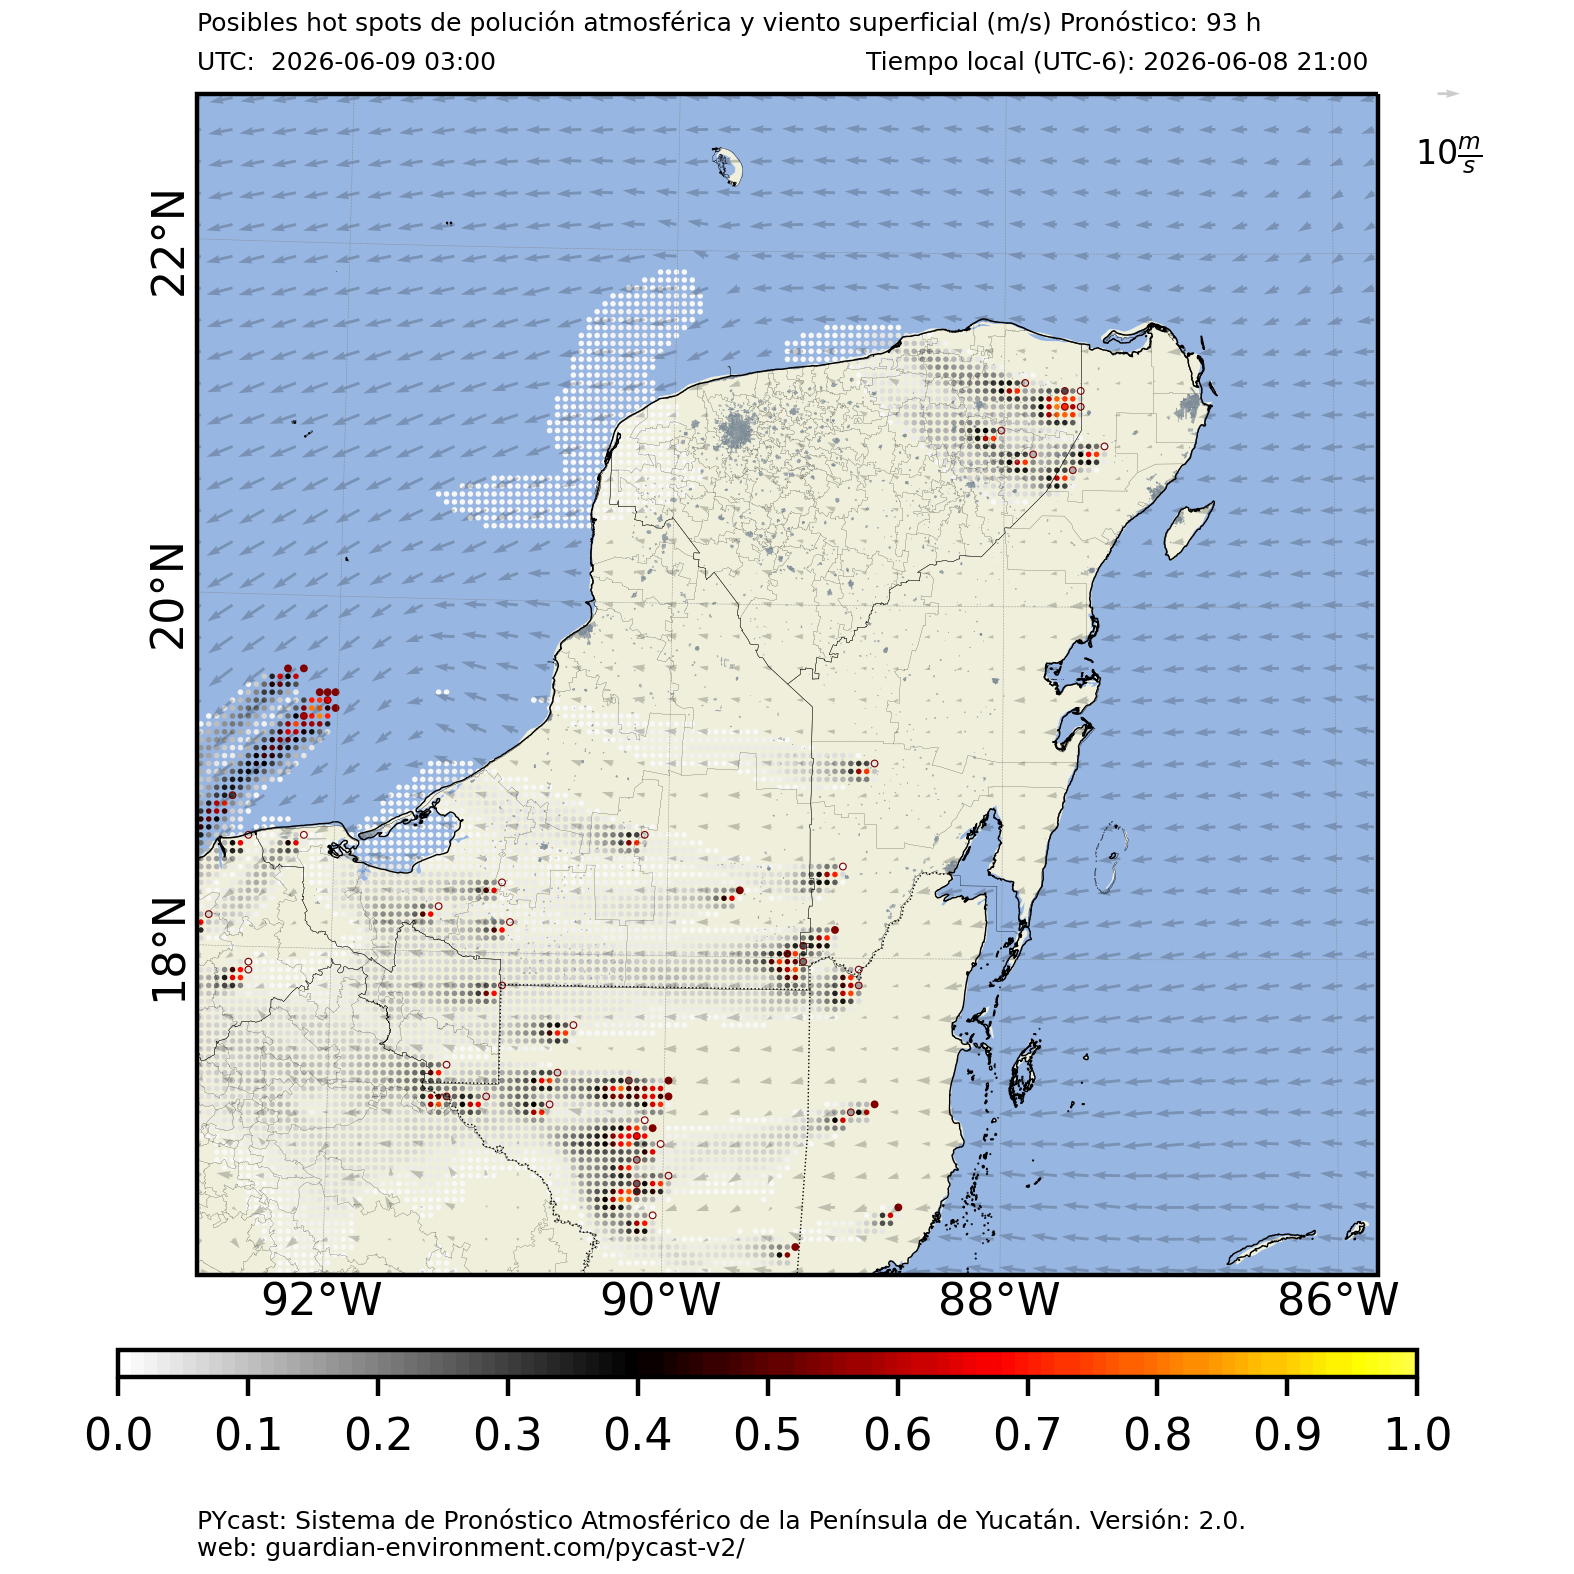
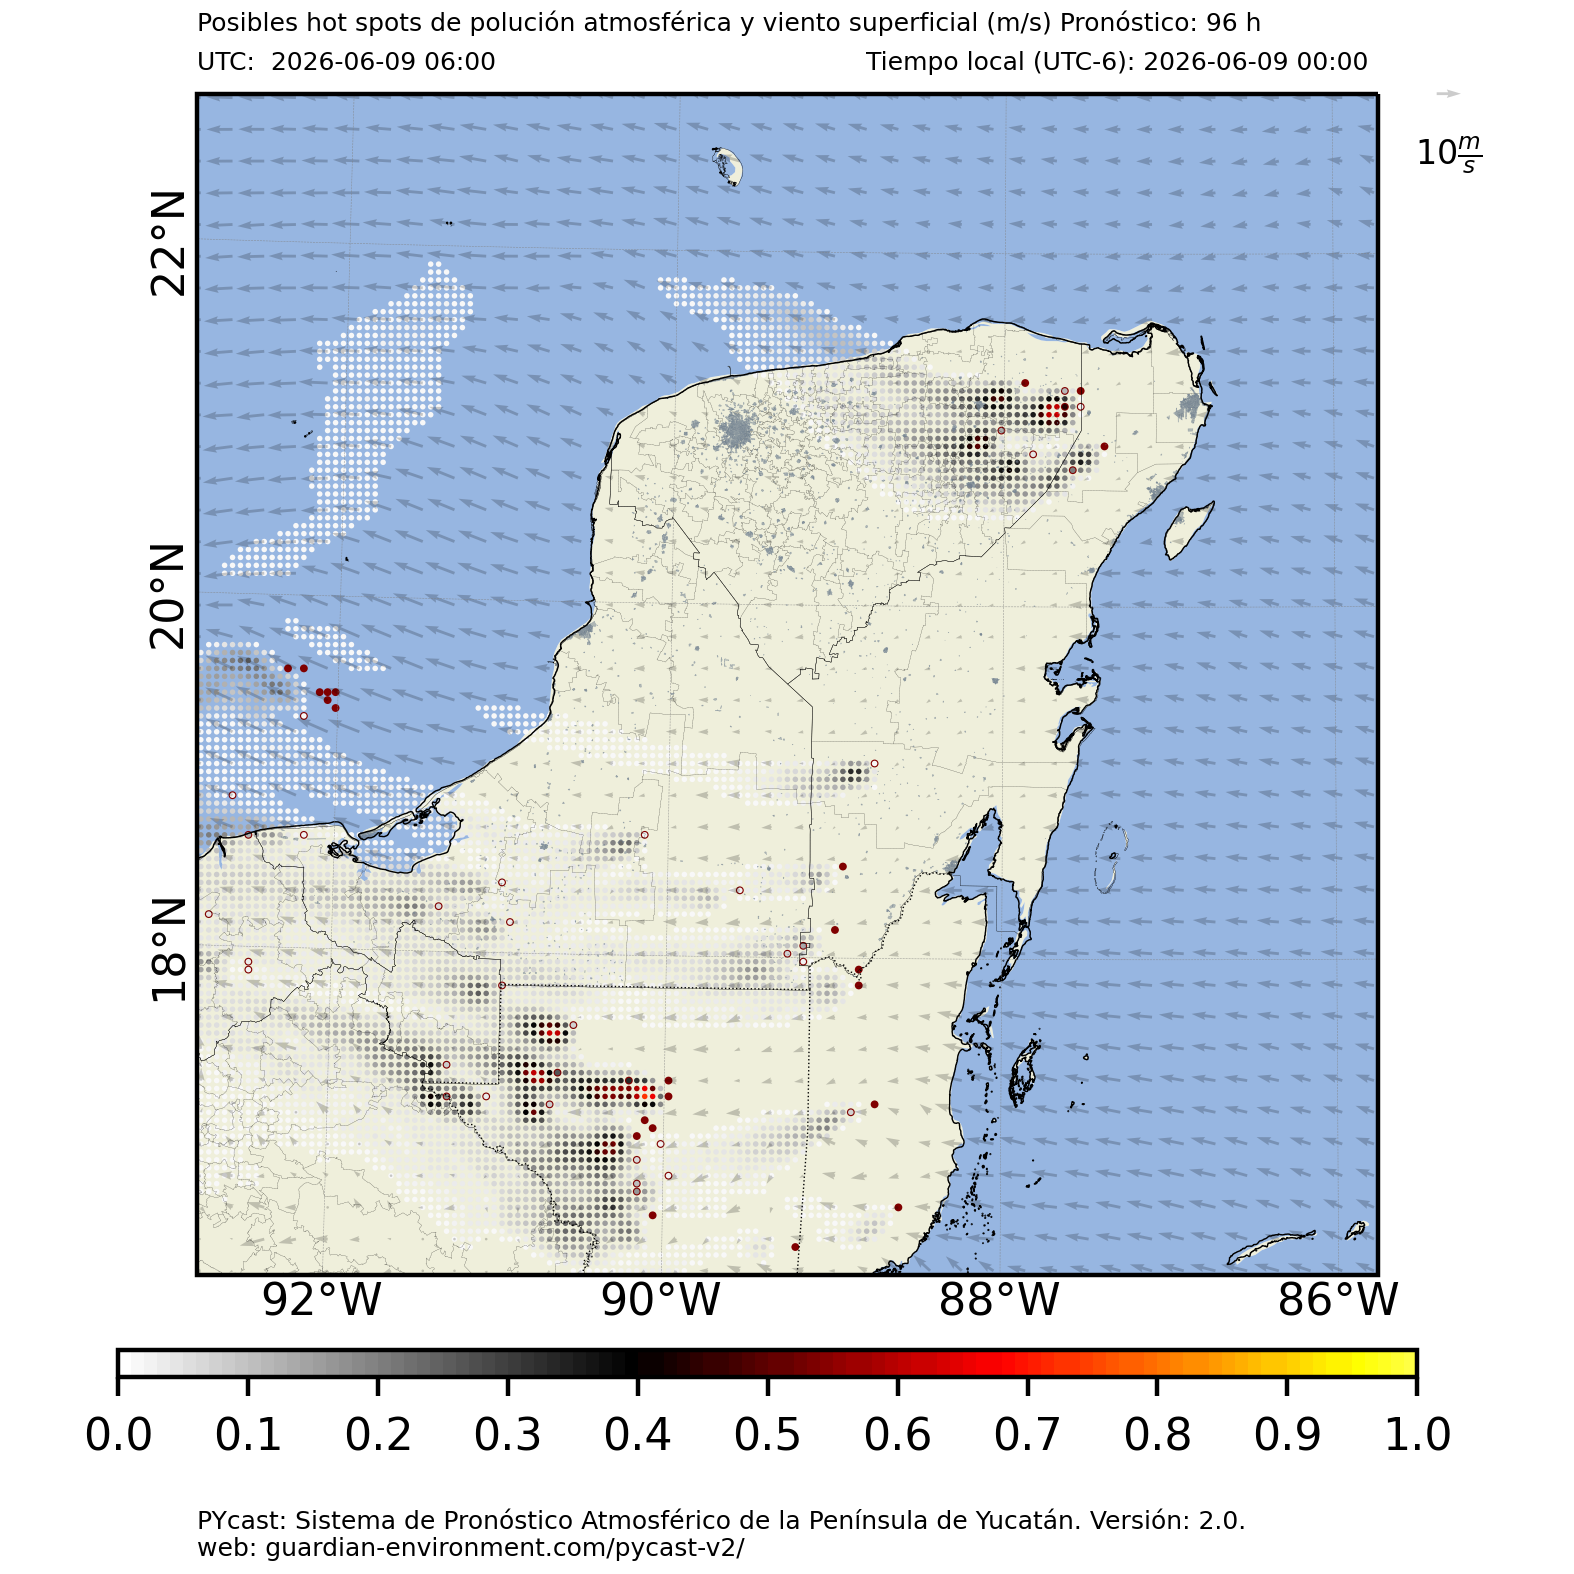
How to interpret the colorbar:
PYcast Kauil applies a normalization using the maximum concentration over the entire region, in that way a high polluted area can be represented as red-yellow points, and low polluted areas as grey- white points. The normalization process helps to visualize the dispersion path of a wide range of satellite detections.
Both the location of possible high/low polluted areas and the extent of the dispersion plume are just an approximation; we encourage users to use PYcast Kauil products as a warning only.
Please note:
be aware that plume dispersion patterns cannot be linked to naked eye observations or satellite imagery (depends on the wildfire scenario) use this information as a warning. If you want to know more about PYcast-Kauil, contact us (see Questions and Feedback).
Descarga de imágenes/Download images